Saturday, December 31, 2005

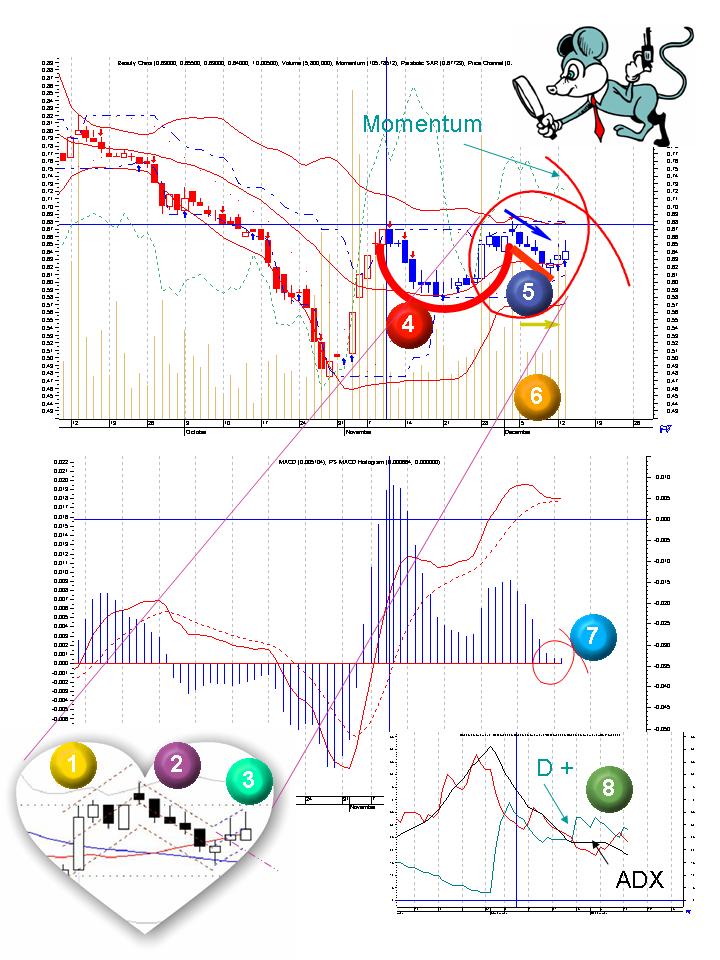
Beauty China (B15) - TA and its Study


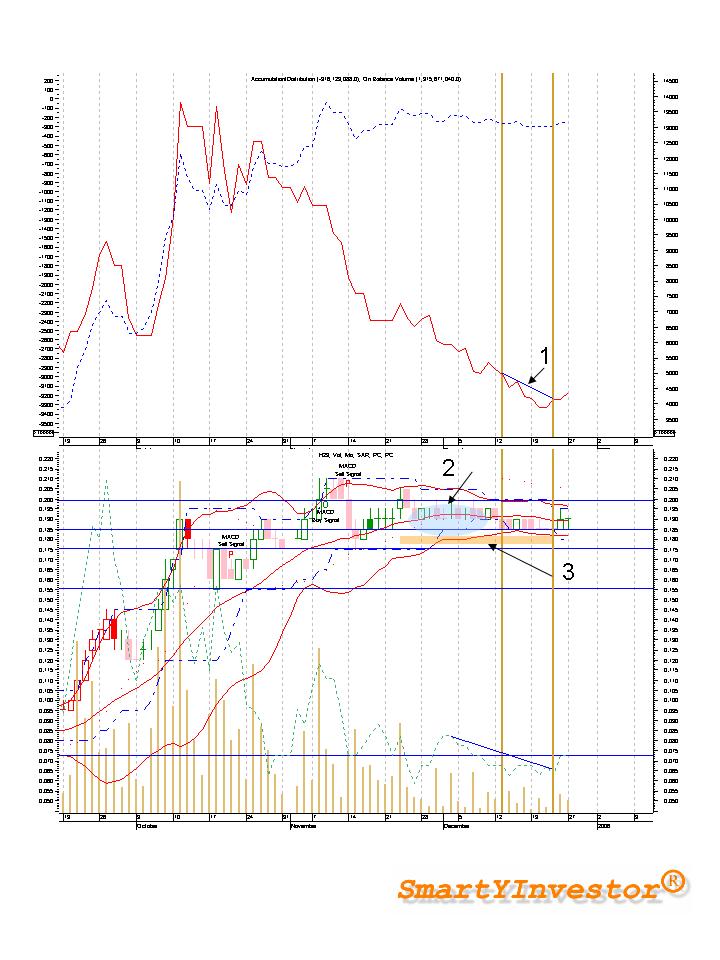
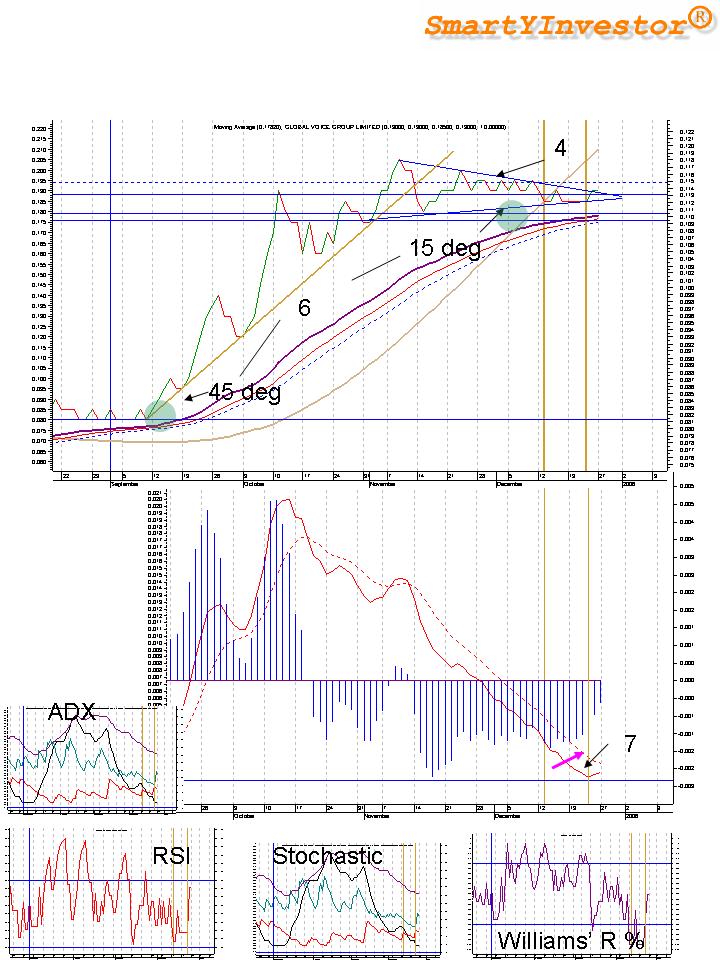
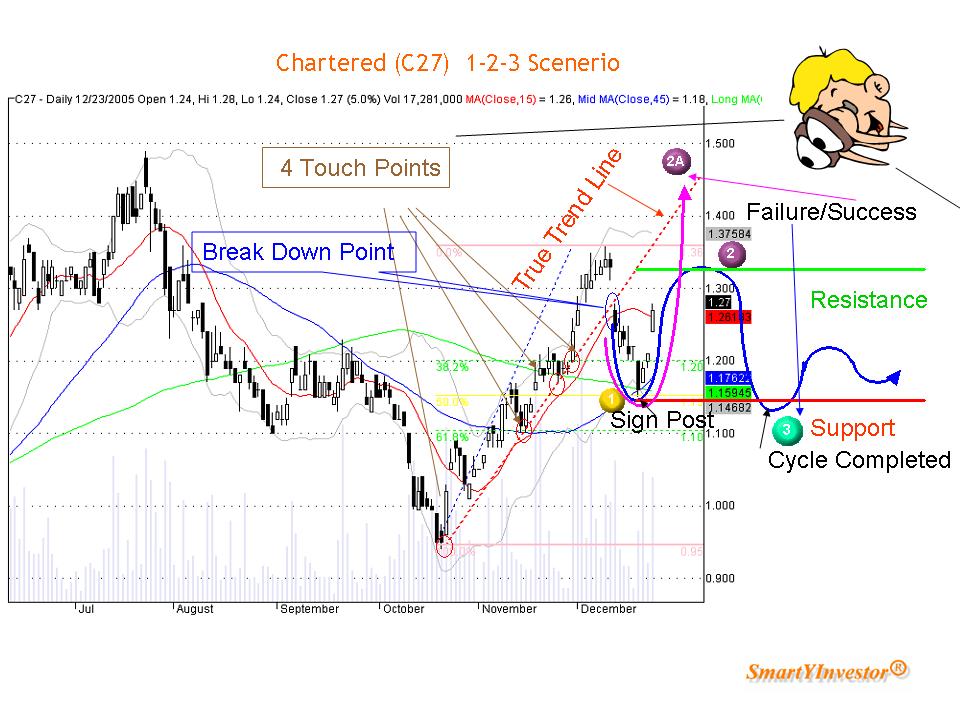
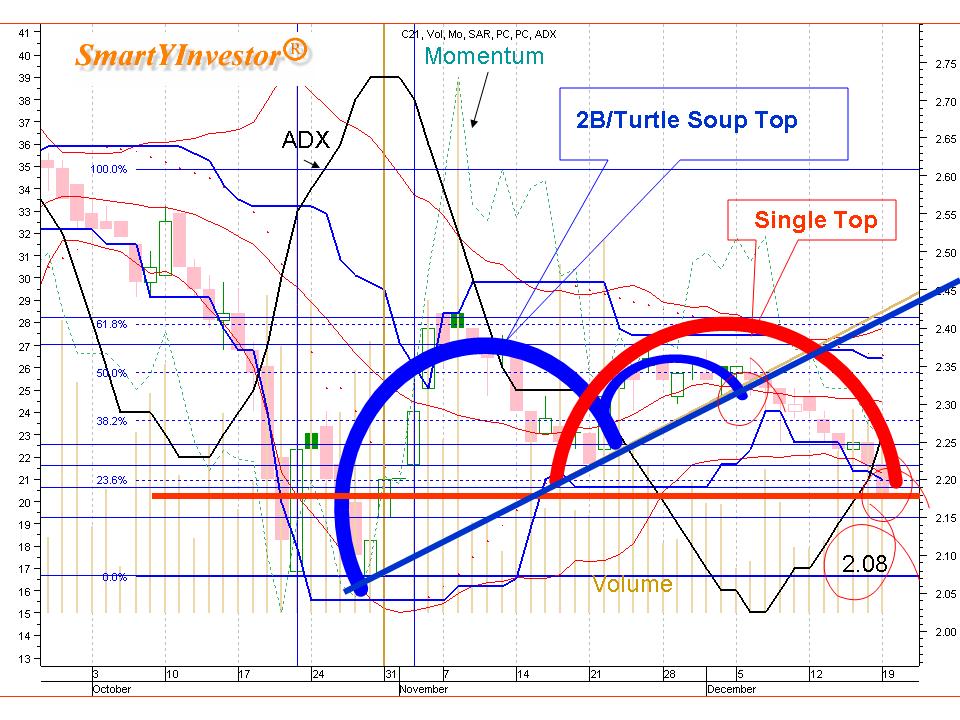
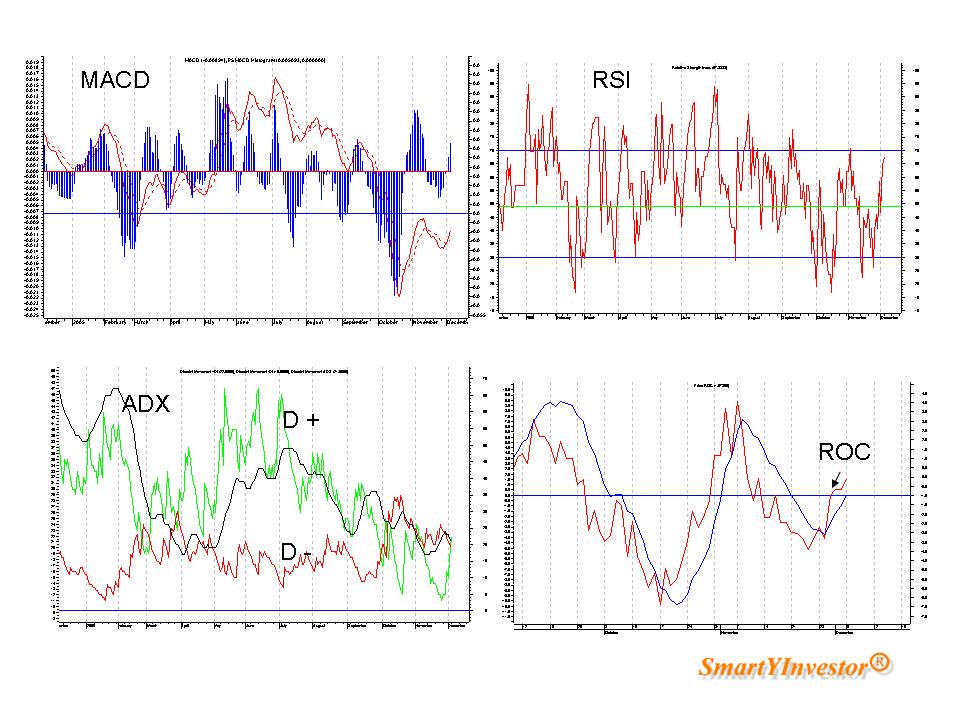
Not all Breakouts have got trendy potential. As in sailing, it is important to know which way the wind blows (in trading we mean trending direction and its sustainability) and at what speed (Trend strength). Beauty China Chart (2) shows 2 distinctive patterns: Simultaneously, a Descending Triangle and a Double Bottom within the Triangle. We shall down play RSI and Stochastic as they are most effective inside Trading Channel. Therefore, we would use the Trend-following Indicators like Moving Averages, MACD and ADX to picture our projection.
Typically, the Descending Triangle is a bearish pattern because the Upper Trend closed with a Lower High. This means buyers are less anxious than the sellers, refusing to raise their bids.
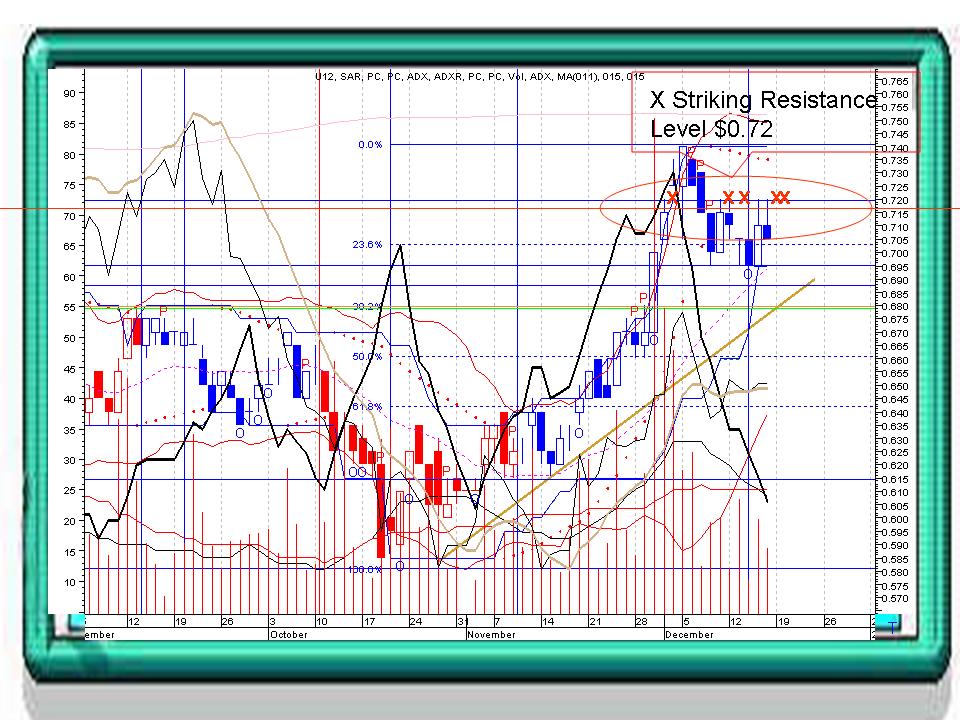
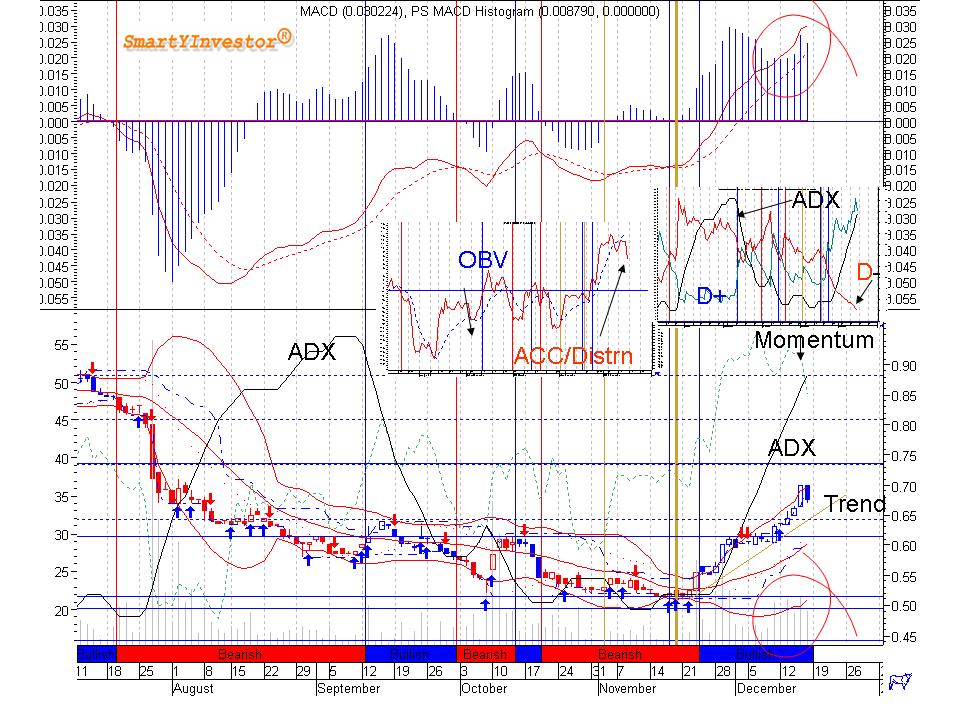
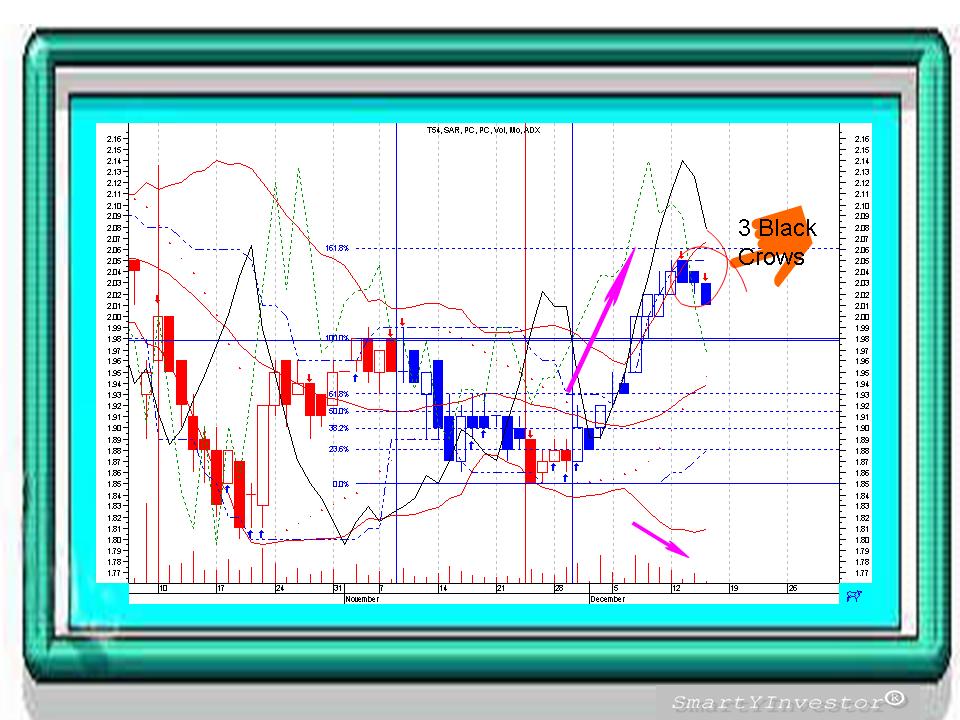
The Breakout of the Triangle occurred on the 29th instant, with heavy Volume. Of course this we know. Thing is, will it holds? So let’s use our selected indicators to test! MA, all cleared, i.e. 8, 13, and 50 EMA... Next, the MACD signals (Chart 3) were also high on the Bullish territory, +ve crossed. Further, ADX (5D) halted its descend and curled up to the strongest trend at 30; screaming for a Buy Signal. I can go along with it, even though I’m aware that the norm ADX is 14 days. Chart 1 shows the bullish 3 White Soldiers marching smartly north! Also,a peek at the ATR is showing a declining trend. To me this means there shall be no problem seeing the Retracement of 50% to 0.75, my envisaged Resistance level.This also approximately coincided with depth of the last Bottom's trough reversed upward, thereby emphasing its significance. Using the base of the Double Bottom as a guide the Support level reads as 0.64. If China Stock is still hot in 2006, this provides window of opportunity, isn’t it?

Blunders will hurt returns much more than brilliant moves!


This advice can save or make – us a lot of money. It’s simple: Just don’t make mistakes. Our investing success will be determined by the mistakes we make: by the number and the magnitude of our losses. Invest for long term, take what the market gives, don’t overreact when it goes down, and don’t mortgage your house when it goes up. Minimize expenses. Don’t take unnecessary risks. Have an investment plan, and stay with it.
Pretty basic stuff, to be sure. But how many of us consistently stick to these basics? (Abstract from Individual Investor)

STI - DEC 30 2005

The "Crystal Ball" of MMI (M29)


Friday, December 30, 2005

StatSChPac (S24) Updated as Requested


StatchipPac (S24) does not look well. Stochastic shown overbought, Williams’ R % and RSI curled down already. Also a bearish divergence MACD signal against the Price. Rubbing sour into the wound is the fearful look like “Head and Shoulders” set to complete its task.
The Dormant Black Candle today shall deter new buyers! Until the dust is settled, it may not be prudent to enter trade as today’s high volume on dip is surely dangerous!

Shipping Surcharge Increased

Thursday, December 29, 2005

STI - Dec 29 2005


STI closed above the 2340 level yesterday that should signal a move to
2369~2377 with immediate support at 2338~2340. Investors will be looking
forward to Singapore’s 4Q GDP estimates scheduled for release on January 3rd
2006. Consensus poll points to a 6.7% yoy rise driven by strong manufacturing
performance. This should underpin stocks in the current session and provide a
firm tone. (Kelive Report – 30 Dec 2005)

Cosco (C21) Updated


Cosco today breached the $2.20, my last posting resistance level (based on high probability calculation) to enter trade!. Of course it pulled back to $2.17 at closing. The fact of the matter is that the so called Red Chip, the China Stock is now in full swing favour and coupled with today’s Breakout at High Volume, I can’t find a better opportunity than this!. Is it Cosco Cola time to you ?

Neptune Orient (N03) Updated as Requested


Neptune Orient is currently in a Consolidation Channel (1) between $3.36(Resistance) and $3.24 (Support). In (2) we can see the Ascending Triangle is making new higher low and is in a mini double bottom formation within the Triangle. This is saying that the Buyers currently are still willing to pay slight increment of price progressively and the near trend is still up. A Spinning Top against its prior Black Candle would have been bullish in a downtrend pattern. Unfortunately, currently the phase is an inactive stage, as such there shall be not much significance in deciding the future faith. The other clue which is suggestive of non volatility is the MACD signals lines (3) converging its gaps. This denotes the “running out of steam” symptom. RSI tilted up at 65 while Stochastic reversed and curled up at 30 but still negatively crossed.
I see no reason to enter in trade now, as nothing seems to motivate its trigger. I still maintain as in my previous posting that unless $3.40 is breached, putting good money in a sideway environment is surely the easiest way to drain one’s resource.
P/s(30 Dec 2005 8:00am) Kindly factor in good news of increased shipping surcharge in your trade!

Jurong Tech (J09) Still Gold at the end of the Rainbow?


Jurong Tech Intraday wise already had a complete recovery to $1.84. This created the period of accumulation opportunity!. The favourable RSI and the good Stochastic reinforced and gave confidence to move in this direction. Further, the dorminant White Candle together with a reasonable high volume added weight to jump onto this wagon of GOLD! J09 still Gold at the end of the Rainbow?

UTAC (U12) Updated


A Bearish Harami has occurred. It should be served as wake-up call rather than an indication of a violent change direction. Of course, if a decisive Black Candle ensued, that will be the confirmation.

Wednesday, December 28, 2005

Nasdaq Chart and Others


Nasdaq : down 22.53 points, Dow : down 105.5 points & down S&P 12.12
Consolation: Chartered and StatChP still above water. Except Creative down
Be Careful trade with Caution!!

Tuesday, December 27, 2005

Huan Hsin (H16) Updated


I still remain Bullish on H16, even though Stochastic (3) bearish crossed, MACD signal lines (2)tightened, and MACDH envelopes so called “Forest” sloped down. Why? (1) The co-ordinated Volume shakeup and sequent Volume Dried up looked favorable. Even CMF (4) already turned positive. I bang my optimistic probability on MACD signals still in positive territory (above zero line) as a buffer against (2) & (3). Today, we saw an 80K purchase that up thrusted the stock by 1 cent and eventually mellowed down by retail buyers. This is an indication of stirring activities that would likely to re-occur again!

Global Voice (H23) as Requested


Bear Camp
  1. Accumulation/Distribution Bearish Divergence

  2. Bearish Rejection

  3. Long Consolidation period

  4. Descending Triangle: Buyers buying lower prices

Bull Camp
  1. MACDH Bullish Divergence

  2. Gradient of Ascending greater than Triangle Descent

  3. RSI, Willians’ R 100%, ADX neutral

Comment: Very high Resistance level at 0.20, if break sky is the limit. But be warned it’s a tough nut to crack. Support level is 0.185, if cannot hold it will dip to 0.175 then to 0160.

Sunday, December 25, 2005

Season's Greetings


Wishing All Readers A BLESSED CHRISTMAS & A
HAPPY, HEALTHY AND PROSPEROUS (Huat Ah!) 2006

Huan Hsin (H16) Updated


Huan Hsin is on my Radar Screen again. I particularly like the good behavior of its volume (1). Up on Rally and down of Pull Back. Also a Bullish Divergence (2) on the Accumulation/Distribution against the Price. I must also agree that the ADX at 51 flat looks poise for a dive and the Price has a Good Kiss on the supporting Trend Line. Let’s hope it’s a “Touches and Goes” Trampoline.

MMI (M29) Updated


M29 looks a bit struggling and the Spinning Top is definitely not a healthy sign to me! Also the Bearish Divergence of MACD signal against the Price rise weighs it down further!

Chartered (C27) 1-2-3 here I come!


We shall now draw a True Trend Line (TTL- not Tau Tau LiaP) – A TTL is one that Price touches more than 3 times and the preceding high must be higher high.
Let’s use Rule 1-2-3 to unearth the insight of C27 and its Future! On the 12 Dec 2005, the breakdown occurred. (1) is the Sign Post, the one that would guide and determine Step (2), the likely faith? (2A) success and (3) Completion of the Cycle.
This 1-2-3 rule is not infallible but in trading is about putting ourselves on the side of the best odds!
I shall leave you here now,for you to figure out what I actually try to indicate; as to explain further will surely insult your intelligence! As they say, “It all in the Chart!, my friend, it’s all in the chart!”

Friday, December 23, 2005

Tips on how to handle Jurong Tech (J09) today!


Let our Candlestick lights the path of J09. Scenario (1) Blue Candle up from yesterday. Scenario (2) Red Candle down from yesterday.  As long as the final candle did not close the Golden Gap, it is a bearish connotation! Meaning the continuation of yesterday's Downtrend. That level is $1.84. So if you want to trade with the Odd with you, never fight against the Candlestick Theory that has proven by Centuries!

Thursday, December 22, 2005

SPH (T39) Updated


A Young new uptrend has emerged and we are now better off than my last posting on the 11 Dec. in which I did not have the dormant White Candle that was anticipated to kick start the uptrend.   The recent “spinning top” followed by a Dragon Fly Doji would likely to bring prosperous fortune, flying to us soon. I particularly like Defensive Stock in Oversold environment. We are now in it. Why? A  Good Upside can be safely expected!

Nera Telecom (N01) Updated


Nothing really pretty to talk about as in Chart 1. I would think it would be more of a short term downside than upside. Why? A recent black candle occurred ,and as in chart 2, we can see Double Top inching to perfect its pattern. Similarly Dead Cross is about to form! All in all, a very Oversold Near term with Longer term trend still intact; as exhibited from the Stock still way above the 50 EMA

Jurong Tech - Be Warned - Don't BUY!!- Seagate taken over Maxtor

Hard Disk Drive Sector
Seagate's suppliers to benefit from consolidation


Seagate to acquire Maxtor. Seagate and Maxtor have jointly announced
that
they entered into definitive agreement, approved by the boards of
both
companies, in which Seagate will acquire Maxtor in an
all-stock
transaction. Investors will receive 0.37 Seagate shares for each
Maxtor
share, valuing Maxtor at US$1.9b or US$7.25 per share. Thus,
Seagate's
shareholders will own 84% of the combined company upon completion of
the
merger.


Seagate estimated that the transaction is at least 10-20% accretive to
cash
EPS and will generate annual savings of US$300m in operating expenses
after
the first full year of combined operations. The combined company
will
retain the Seagate name and corporate HQ at Scotts Valley,
California.
Seagate's executive management team will continue to serve in their
current
capacities. The transaction is scheduled for completion by second
half of
2006, subject to shareholders' and regulatory approvals.


Consolidation positive for HDD industry. Seagate is the largest HDD
maker
with global market share of 28% while Maxtor is the fourth largest
with
global market share of 14%. The acquisition will further
strengthen
Seagate's positioning as leader in the HDD industry in both
breadth of
product offerings and operating scale. The acquisition will
consolidate
the HDD industry from seven major players to six. This will
eliminate a
weak player but enhances bargaining power of existing HDD
makers.
Consolidation in the HDD industry has traditionally had a positive
impact
on earnings for HDD component suppliers. For example,
consolidation of
Maxtor's supplier base after Maxtor acquired Quantum had a
significant
positive impact on Jurong Tech's earnings in FY02 and FY03.


Seagate's suppliers are key beneficiaries. We expect Seagate
to be
relentless in cost cutting to achieve cost synergies and economies of
scale
provided by the acquisition. Beneficiaries for the transaction
are
Seagate's suppliers such as Magnecomp Precision (suspension
assemblies),
Magnecomp International, MMI (base plates), Beyonics (base plates)
and
Seksun (top covers). Maxtor is the smaller entity in this transaction
and
Maxtor's suppliers are at a disadvantage when Seagate consolidates
supplier
base for the combined company. Maxtor's suppliers, such as Brilliant
(base
plates), Cheung Woh (VCMs) and Jurong Tech (PCBAs), face
uncertainties of
losing market share.


Magnecomp Precision (MPT) is prime beneficiary for the
transaction as
Seagate accounts for 70% of sales after reverse takeover of KR
Precision.
It has an entrenched position within Seagate's supply chain and
accounted
for 50-60% of Seagate's requirement for suspension assemblies. MPT is
also
ramping up production for Western Digital and Toshiba's 2.5-inch
HDD
programmes. It has commenced production of suspension assemblies
used in
1-inch HDDs for Western Digital in 4Q05. It has secured qualification
from
Toshiba for 1.8-inch HDDs and volume production will commence in 1Q06.
New
Wangnoi plant has broken even in Sep 05 and is expected to be
profitable in
4Q05 and FY06. Valuation is attractive with FY06 PE at 7.7x
(Hutchinson
Technology: 19.9x, NHK Spring: 26.8x).


Magnecomp International will benefit via 74.4% stake (after
factoring
recent placement of 177m new MPT share to institutional
shareholders) in
MPT. Its Data Storage division or MPT accounted for 57.3% of sales
and
67.4% of net profit in 3Q05. The stock trades at FY06 PE of only 5.9x.

We expect the transaction to have a negative impact on Jurong Tech's
share
price. It supplies PCBAs to Maxtor, a business that accounted for
18.3% of
sales in 3Q05. Although HDD business is not a growth driver for
Jurong
Tech, the potential loss of sales to Maxtor will make Jurong Tech
overly
reliant on Motorola. We expect some selling pressure for the stock in
the
near term.


The transaction has a neutral impact on Unisteel as it has a
diversified
customer base and supplies to both Seagate and Maxtor. Exposure to
HDD
industry has been reduced from 80% of sales to 65% following strong
growth
for fasteners used in non-HDD applications (mainly for mobile phones
and
video game consoles) and acquisition of Valen Technologies.


HDD Sector

Magnecomp Precision (MPT TB)

BUY
Current Price: Bt4.22
Target Price: Bt6.20


Magnecomp Int'l (MGCP SP)

BUY
Current Price: S$0.985
Target Price: S$1.21


Unisteel Technology (USTL SP)

BUY
Current Price: S$1.80
Target Price: S$2.28


Jurong Technology (JTL SP)

BUY
Current Price: S$1.84
Target Price: S$2.36

Wednesday, December 21, 2005

Jurong Tech (J09) Updated


A MACDH envelope had a Divergence against the Price. Notice that today’s bar and its prior one remained flat, Price continued to drop. This is a signal to get ready for a reversal. Next, the Stochastic has rolled over and was heading north, as %K crossed above %D for a Buy signal at precisely 20!  So, if that wasn’t a clear signal, then I don’t know what is!

Disclaimer: No document/material here is a solicitation to buy or sell. You are advised to think carefully and take your own responsibility for all consequences.

What Time is it? Cosco Cola Time!


Using the Single Top and Base Line to calculate the ultimate downtrend, we have (2.36 – 2.22) = 0.14, i.e. the depth. Using equal depth, we can assume that the down cycle would end at (2.22 – 0.14) = 2.08.  This assumption was reinforced by 100% Retracement since early Oct; this also happened to the bottoms of the 2 candlesticks at end of Oct; which forms the Support Level. Today, I monitored closely the behavior of this stock, I take it that the best possible price could be purchased is $2.10. I congratulate those buyers who seized this opportunity. Scrutinizing the Trade Summary I see at 16:47 (100,000) and 17:05 (352,000) “biggies” buying qty. To me, I doubt we can have this price resurfaces again! As they say, timing is everything!

P/s Someone asked for the Target Price. On normal declining trend, 61.8% Retracement can be expected. That shall bring us to $2.42!

Disclaimer:No document/material here is a solicitation to buy or sell. You are advised to think carefully and take your own responsibility for all consequences.

Tuesday, December 20, 2005

Jurong Tech (J09) - A GOLD at the end of the Rainbows!


A Harami cross formed on the first day of Dec stalled the advance. Since then, it was a steep downfall, made severe by the latest 3 Black Crows! As in (1), a Single Top seems imminent. We can see (2) the gap would have been filled to form a perfect pattern if not for the unusual reversal of white candle today which saved the fall. Notably, (3) the bottom wicks of the candles formed a good resistance level at $1.93. Furthermore, the convergence (4) of MA (13D) & MA (45D), and the nearness of the Fibonacci Retracement of 38.2% at this resistance level added significance and improved its validation.
The weekly chart of the MACD is still in the –ve and oversold territory and with the  daily MACD (5) now giving us the 1st uptick, to me, this is the best , and safest signal I know of that can improve quickly our profit in the Balance Sheet. No need to present other indicators, though not all the best, it gives me confidence of a “come on’ and upside potential!  I put the Target Price of $2.04 is for a reason. It’s the peak of the Single Top pattern!
So,is there GOLD at the end of the Rainbows, you tell me!
P/s No document/material here is a solicitation to buy or sell. You are advised to think carefully and take your own responsibility for all consequences.

Monday, December 19, 2005

Cosco (C21) as Requested


Cosco already had a 2B/Turtle Soup Top; began on the 28 Oct 2005. It ended on the 12 Dec 2005 against its Trend Line. This pattern is a bearish intent. Looking at another lens on the same perspective, a Single Top was formed on 21 Nov 2005 ended today. The price breakthrough at the support level of $2.20. To add significance to this endeavour, it almost coincides with 23.6% Retracement. All these are pointing towards a tumble to the next support level at $2.08.
All other indicators are really bad as ever. It’s all in the Chart 2.
Candlesticks look really frightening! 2 recent Shaven Colored Candles tell it all. See without any wicks at top and bottom. It signifies dominant bear occupancy. The high volume accompanying the Candles and the forceful ADX rushing upward at 28 (most trendy stage) clears further doubt of a very bad near term!  

Sunday, December 18, 2005

UTAC (U12) - Bearish Rejection


The above sighted. Candlestick evidence is: where several upper shadows at approximately the same price ($0.72) at resistance level (this case 5 times). Meaning the share is having difficulty closing above this level This has a bearish implication as selling activity undermines the power of any bullish uptrend. So stay put and don't "cheong" if this resistance level is not cleared.

Nera Telcom (N01) as Requested


The Good
Since there is only 1 good thing to talk about this share let’s start with it first. This is the Moving Averages (MA). Throwing a net of 5, 13, 50 EMA, catches the trend quite easily. From the chart above, Dead Cross has not been affected and price still above the 50 EMA. These are telling us that currently short trend is going to be neutral or bad and mid and long uptrend are still intact (uptrend). We can clearly see the curling of the 5 EMA (red) and its narrowing down towards the 13 EMA (blue).
The Not so Bad
On the neutral side, the stalling begins from the RSI flat at 60. Accumulation/OBV and ADX though still up was clammed by equally flat D+ and D-.
The Ugly
And now the worst scenarios: threatening the downfall were William % R (-25) and Stochastic negatively crossed at -40.
Since 7 Dec 2005 MADCH has been deteriorated. 8 bars/envelopes have been gunned down progressively. This is telling us the spread between the two MACD lines was narrowing, the positive relationship weakened and surely going to be out of gas!
In searching clues for confirmation, the (slow Stochastic slow D% and Momentum)’s bearish divergence against the Price cannot escape my scrutiny. As mentioned before, in the fate like this, the expected outcome would be Price falls in the direction of the divergences.
And now is the time to torch the path and see is there any light at the end of the Tunnel! Candles in hands, we can see, after 5 Dec 2005, the subsequent, 9 periods are in Consolidation stage. According to Candlestick’s theory, another 6 similar inactiveness will exhaust the bull, and the support level of $0.45 shall be hammered through. And that’s theory. However, cemented this theory was the evidence of the last 5 riveting at that support level. Again, may I ask what outcome you can imagine? My hunch is that if the resistance of $0.465 is not pierced through, reversal shall happen! Why ? : the Dominant Shaven white Candle on the 5th instant is significant in deciding the future of this stock. This is Candlestick theory of the so called in between candles.
Sidetrack a bit. They used to ask me as why TA Analysts are better off than those reading the Analysis. I can only say that: “Technical Indicators are the past- the history, so understanding in and out of the chart is the just the beginning of the beginning! It’s just what happened before! A shrewd TA Analyst will know “what the indicator will do before the indicator actually does it!”

Saturday, December 17, 2005

HuanHsin (H16) - A Gold Mine or a Land Mine?


It is imperative that to judge the captioned above, one must understand as to what phase, the price action is now and resonant it with mid/long term outlook; so as not to be discouraged by occasional clusters! Without the understanding of this, just saying “will go up or down”, sees, that’s gambling not trading!
Longwinded, let me hold your hand and walk through this “Do or Die” mine! With a Candle in hand, we can see that a dominant black candle against its opposite color predecessor. A sign of exchanging camps – Bear has taken over.
In rhythm to this sudden mishap, RSI, Stochastic, Williams’ % R, ROC, and Momentum conspired its downfalls. Very OverBought, right?  Sure, just look at the Bollinger Band, RSI, Stochastic, MACD signal lines’ position in the +ve territory, who need more evidences?
On the more neutral perspective, ADX still maintain its vertical image, but maybe of slight concern now, as 51 seems dangerous in comparison to its previous downfall of 56 in early Nov in current year. Huh, huh, surely we can see the tussle between the top D +ve (Blue) and bottom D-ve (Red)! You tell me, between the Red Devil and the Deep Blue Sea, who will win? I enjoy watching these 2 lovely birds, the Accumulation/Distribution and OBV, in this instant, friendly they tipped down in perfect sync. How dangerously can they be,unless further proven, right?
On the brighter side, you will notice a choreographically MACDH and Volume sync with the Price since this month; this is very significant. Meaning Trend is still up and bull is still in control. How to see?  In particular, you can catch the past 2 preceding MACDH and Volume bars’ performance.  Price rise on high MACDH/Volume and pullback on low MACD/ Volume.
So, so, one black swallow (black candlestick) does not make a summer right? Then, let go to the risk/reward evaluation!  Just my thinking aloud: the risk high? Not even 35% retractment since early this year at $1.13. Of course there is danger in overbought stock, but overbought can be overbought for though not in infinite time but for long enough to churn profit. Upside is still untapped as from its 200MA, still below it by 8.1%.
Enough been said, between the “Promise of Rose Garden” and the “Baby Caretaker”, would you like to stretch your luck?

Friday, December 16, 2005

Comfort Delgro (C52) as requested


Let’s light a Candle and look into this TAXI! Since mid Nov 2005, the resistance of $1.57 was tested 17 times. Also in the Candlestick language, the so called “Bullish Rejections” occurred. Notice most of the candles have their heads knocking the ceiling with most of them having little tails called “springs”. This has a bullish implication as buying activity has been occurring at this same price level. Surely, it has to break through and it happened on the 12 Dec 2005. But after that sad story happened! A Gravestone Doji surfaced. Since Doji was derived from Japanese word for “feudal lord”, you know surely what they will do, if Graveyard was mentioned? Followed by a thrust (top wicked) black candle and then a shaven black candle. All these would be expected to be heavy on the $1.58 support level. Probability of sinking will be high, right?
OBV flat and Accumulation/Distribution down. RSI stayed neutral at 58. So was the Williams’ R % but flat at -40. These indicators are taking a neutral stand
The bad ones are the MACD histogram with sloping envelope and the frightening Stochastic smashing down, negatively crossed from the overbought zone. These are bearish clues. Also very low Volume today is indicative of total lack of interest from the buyer side.
ADX with its favorable placed D+ and MACD signals uncrossed would certainly provide some muting of these short term bearish environment.
On balance, a very overbought and bad short term can be probably expected. So currently, it looks like it going sideways, and if you are the very patient type of trader, you may still benefit, (Warren Buffet’s style.) What long long!

Thursday, December 15, 2005

StarHub (T54) Still the shinning star?


Any share that trends at a near-vertical angle, straight up into the heights of the blue sky, always concern me. Our Shining Star has shot up “too soon and too fast!”  The law of Physics:”What goes up, must come down!” With trading, often the angle of the uptrend will match the angle of downward correction! Let’s look at the Candlestick Pattern: Woo… 3 black Crows, that’s bearish at its worst signifying continuation of downtrend. I was watching the Volume for the past periods and never like the way it portray. The most fearful scenario:” Fading Volume during Advancing Wave”. What does it means? Those who have been driving the price have finished their accumulation work and the continued rise is being fueled less by true enthusiasts but now rather by come-lately momentum players! Put it in another way: For example, in an uptrend when you see volume drops progressively in a crescendos rally, beware! Reversal is close at hand!
No need to run over the remaining indicators, all look bad to me! Except ADX though down but positively placed and MACD signals lines still considered bullish.
In sum, very bad for near time!. All’s not the end, mid term and long term still remain bullish. How to know: by the MAs still parallel and not crossed down yet. So all yours, it all depends on who you are, your style and your stomach, weak or strong? You know better!

Wednesday, December 14, 2005

NOL (N03) as requested


NOL already pierced through its trend line on 5 Dec 2005 with a Gap (Ang Mo), Japanese called it “Window” – “same same!”. After that the Candlesticks revealed unstable phenomena. The next day after the Gap we see the most Dominant Black Candle and almost “Shaven” –Marubozu Candle with high volume. This would mean bearish at its worst! Subsequently a small white candle within the frame of its preceding Black Candle, the so called Bullish Harami and that is good; the bull had won. Then again, a Dark Cloud shadowed its preceding white candle: and that’s no good. And then Doji X 2. These smell indecisiveness. The implication is that too many Dojis shall jeopardize upward movement against its resistance .Without looking at other indicators we can safely say now that inactiveness will ensue! Unless new impetus surface, sideways consolidation or down trend would be the likely outcome.
So full stop? Of course no!, I wish trading life can be that straightforward!. So let’s proceed to dig more insight so as to confirm the above hypothesis.
Let me throw a net of EMA 8 days & 13 days to detect whether N03 is in the Dead Cross Zone. The result tells us that it is not. This reflects that instant downward curl is not coming soon.
RSI (5 days) has a small double bottom whipsaw and terminated flat at 68. Williams % R (14 days) danced gracefully in concert with RSI depicting similar pattern but at -32. So what does these mean? Simple, above hypothesis confirmed!
We can use ROC and ADX to gauge the strength of the future trend. Both confirmed that trendy movement cannot be expected in near term. See, the D+ve came down fiercely although still managed to stay above D-ve!. Luckily ADX, confirmed by its smothering counterpart ADXR still almost vertically erected to defend its downfall.
Stochastic seemed unfavorably crossed and most recent MACD envelope slope down against its preceding one. In the absence of fresh evidence, this is bearish, even though the MACD both signals are still signaling a bullish stand. No wonder, chart pattern cannot decide for us. Let me bring to your notice, the MACD Peak and Trough. Surely you can see the Peak’s height is greater than the Trough. This would mean that bulls ‘strength is still superior to the bear.
Accumulation/Distribution looks OK with OBV wriggly neutral. Volume mild in comparison with recent 10 periods: 2.7 mil Vs 4.3 mil
Fundamentally, NOL’s unnatural Gap (Dec 5) has to be covered. The Market became enthusiastic about the promise of special dividend payment then. After Xd, the price of the share often falls dramatically.  From experience, many Xd Gap recover with 5 to 7 sessions if the share is still in uptrending. I bring this out because the current price is factored in all these, but actually its realistic value is only $3.00. I bet, you got to believe me, Price has got Memory, you know!
In sum, $3.40 resistance which is top of the Bald Head Black Candle (Dec 8) is a tough nut to crack! Why? unnatural Gap has its latent effect of buying over priced still  fresh in most traders’ mind.  Unless the Trend  Line broken at near  $3.10, NOL would be tamed in near term!
I don't like to be ambiguous, but if $3.40 resistance happens to be hammered through, I can't rule out it will "cheong" to $3.80 (recent top) and beyond, since the trend is still up now!. I think those vested need a lot of Lucks so as to "Huat" in this way!

Be Warned! - It is a good CASE!


Question
Posted: Wed Dec 14, 2005 9:57 am    Post subject:    

--------------------------------------------------------------------------------

Ongsmart, i am not a technical person. Does your chart mean that Creative will be bearish? I thought you posted the breaking point was 14.20 few weeks ago? Care to explain the technicals?
Thanks
Cats
ongsmart

Answer

Joined: 04 Jun 2005
Posts: 144

Posted: Wed Dec 14, 2005 11:26 am    Post subject:    
--------------------------------------------------------------------------------
Hi Cat,
Kindly do not react to change emotionally. Chart changes every min and TA is probability and not possibility.
My purpose to post CREAF - Creative in USA this morning is just for information: that arbitrarily Singapore Creative would be adjusted downward (no always) and the Bearish Harimi is screaming that today Creativity will drop (not always)
Buying in stock and selling cannot be viewed as Static. Although I still maintain that the said key resistance, you have to watch it for yourself. Since my last posting many many things happened. Creative seemed currently is not in favor because of Xmas buying spree as Apple Ipod seemed to get the better of them. Also lately law suit matter just whipsawed the price upwards. Since my last posting Creative may grow old and ugly anytime, be careful! Also it may shoot up when catalyst like earning report, price cutting, lowering inventory stockpiled somewhere and etc and etc. So who knows - Again remember, chart changes by mins OK!

Cats
Joined: 01 Jul 2005
Posts: 78

Posted: Wed Dec 14, 2005 11:33 am    Post subject:    
--------------------------------------------------------------------------------

thanks a million for sharing.

Creactive - USA (CREAF) Dec 13 2005 - Bearish Harami

Tuesday, December 13, 2005

Beauty China (B15) as requested


So, we are in the Beauty World, let’s examine the heart of this beauty. At the bottom of the chart, we can see 3 Regression Channels (RC); (1), (2), & (3). We will know that RC (2)‘s trend is milder by comparing the height of RC (2) and its preceding RC (1). This clue is confirmed when finally (yesterday) it breakout with good volume at the junction of RC (2 & 3). Quite obviously we can see (on top of the chart) labeled (4), a Cup with Handle Pattern surfaced. In addition, we can bet its good likelihood of success by its wedged handle (5). Why, it‘s because probability of success of this type of handle is much better than the leveled one!. So “cheong”, right? Wrong! I was anticipating today’s follow up would be moderated. Why? This is because, at the handle: its sliding change was met with a leveled volume change (6), not a synchronized downward slide; this is volume divergence! That’s reason why today, despite of good volume, price change is small in comparison. This” cycle off volume” is to allow the sellers whom have not finish selling before to finish selling their ware.
The next favorable question is “can buy or buy?” Let’s us put on our TA gears and start scrutinizing it! Oversold or not?  - This is to get advantage point when buying. : MACD (7)envelope above its equilibrium level, Price above the Bollinger Band’s mid line, and RSI curled up from 35 to 55 are suggesting that it is not so!. However, Stochactics is screaming a BUY due its just emerged from the oversold area. Accumulation/Distribution is saved by its confirming OBV which is still marching smartly upwards. Concerning its future trend, ROC wormed down but still above its zero line and ADX down but D positively placed. This can be taken as uptrend would likely be continued but no instant rally can be envisaged soon!
Adding to this bullishness, is the Williams’ % R rounded its descent and already sharply shot up to -45 from -63.
To see the forest from the tree, we mustn’t forget our Candlestick. As of yesterday, a Morning Star already formed. This means the bears have been sent into hibernation and its robustness confirmed by today’s white candle.
In sum, weighing today’s Volume which is 5.8 mil, as against the 3.6mil (recent averaged 10 periods) and the contradicting “not so ambitious” Momentum exhibited in the chart, we can safely say that upward trend’s probability is high but certainly it would not be that of a “Too soon too fast!”

P/s: Someone has asked for Resistance and Support Level. Here there are:
Sub Reistance is 67 cents; already tested 6 times since middle of Oct 2005 and Main resistance is 72 cents. Sub Support: 58 cents and Main Support: 50 cents

Monday, December 12, 2005

Chartered (C27) Update


There is bearish divergence between the Price rises against the Accumulation/Distribution drops. OBV, ADX and Momentum already slacked miserably. Stochastic (-ve crossed) and RSI shown their most fearfully plunge from an Overbought territory. ROC went under its testing 10 Day MA. This throws insight of a bearish environment. From the MACD Histogram, we can ascertain that the strength of price rising has been weakened due to its dropping envelopes and its last envelope’s height which was shorter in comparison with the depth of the preceding MACD trough. The biggest bad omen is a spin top surfaced, terminating its preceding upraise. If another black candle appears, traders ought to be very cautious as we will be moving close to a deep curl downward.

Sunday, December 11, 2005

SPH (T39) as requested


Bad News:
MACD envelopes slopped down and –ve crossed. This is bearish! The bigger the amplitude of histogram cycles, the larger the price cycles. This means it takes time for prices to rise due its having have to complete the declining turns.
Good News:
Acc/Distrn and OBV chart is starting to curve up and the RSI has halted its descent and has turned up from below 36. An upturn is bullish and from below 30 is very bullish! In resonance, Stochastics are suggesting good upside as it approaches the oversold region.
Candlesticks:
Let’s us have a peek at the Candlestick Pattern. Ah…! A Spinning Top has occurred. It represents a tug-of-war between the bulls and the bears. Because there is no gap between the preceding black candlestick, hope of an imminent reversal may not be a “sure case” as the one that has got one. Nevertheless, and kindly bear with me a bit longer and let me take the liberty to explain the psychology of a spin top to my almost confidence-deficit readers.
Like a Doji, spin top suggests a balance of demand and supply. Normally the bull/bear war has to end with the beginning of a new trend (meaning reversal). At least is a pause in market activity!
Notice, the drop of volume – this is expected as buyers refused to pay for the price that the sellers asked. Hence, activity reduced.
In a scenario like this, my sense is eventually the selling pressure will be turned to buying pressure. Why ???  Because the buyers got impatience, just buy it! Encouraged, other buyers join the “herd mentality” buying spree, thinking it is cheap to buy now and also not wanting to miss the wagon of fortune.
Verdict Time
I’m reticent to supply one. But if I’ve to, this is just 1 opinion!
If not already in the trade, wait and watch for confirmation of reversal, just 1 more white candle, the dominant one, i.e. one with relatively higher volume to enter and thus harvest the Xmas ride. Vested one should hold, of course very tricky for those with Warrant’s due date, you got to make your own decision.

Saturday, December 10, 2005

Chartered (CHRT) in US


Danger sign. That is extraordinary volume with very low price increase. TA telling Climax is near. I didn't say anything, TA said it!

STI - 9 Dec 2005


STI well and good, though RSI a bit weak. If the 2350 resistance is cleared, we all can have our Christmas Cheer!

Friday, December 09, 2005

Swissco (5FG) as requested


Although the Bollinger has spread for the last 5 periods signified bullish endeavors, the last 3 periods were clear indications of a tug-of-war between the bear and the bull. One instant was braking of the bull shown by the doji and followed by another: the more recent one: was just the reverse; the reduced momentum of the bear by another doji. What looked more worrying was the sudden and dramatic drop of volume today. 195K as against the average 10 periods of 659K seemed pale in comparison. This together with the doji confirmed indecisiveness. ADX plummeted south to a mere 15 was telling us that hope of a trendy action any time soon will be diminished.
On the Stochastic, as shown on the chart above, there is a bearish divergence building up against the price. This would mean in time to come, price will slack in tandem with the downward gradient of the Stochastic. Williams’ % R slumped dangerously downwards to -40, while RSI though down but was less intensified, shifted to 64 from 70. Other indicators were mediocre in patterns.
On the big picture, based on the MACD envelope and the Stochastic summary, it is overbought in near term and the fact that 1 envelope down in spite the preceding bullish ones cannot decisively determine the faith of this Sweety. It would be more appropriate to wait and see, and if the current  candlestick pattern of this price cannot decide now, who can?

GK Goh (G41) as requested


We can use volume to gauge the momentum or intensity of the price action. Today 72 K Vs 357.7K of the last 10 period averages was not a good quality volume sign. The sloping down of the Momentum indicator and the continuously dropping action of the MACD envelope work in synergy to hammer down the bull. This means the lack of volume consistently would confirm an inevitable downward trend soon. Furthermore the 2 signals lines of the MACD are screaming overbought with its height way above the zero line. Price drifting a way from the Bollinger Upper Band speaks similar story of price about to go south!
Except for the dangerously Williams % R sinking to -55, all other indicators seem acceptable.
I would have called a sell if not for the software’s rating of MACD as bullish base solely on the MACD signal still above its corresponding MA signal. Other powerful indicator that is, the candlestick; shown in  the chart as Bullish Harami by the charting software, although to me, it don’t look like a  prefect Harami. However, this is suggesting an exhaustion of the preceding engulfing bear, revitalizing the possible would be bull soon. Candlestick itself normally requires another white candlestick to confirm its feasibility.
In short, the reward of holding do not warrants the risk attributed to it. But it all depends on what you want. I also see not harm to watch a while more!

STI - 8 Dec 2005

SMRT (S53) as requested


Momemtum continue to drop, ADX down, D-ve waiting to fold over its D+ve counterpart, RSI dips to touch 50, the psychologigal bearish point and MACD already issuing a sell signal today.

Thursday, December 08, 2005

Profit Taking Day for Me!


I've just exited UTAC and SMRT!. Both don't look good to me and TAs wise: what I have anticipated happened. That is UTAC candlesticks got duplicated and heavier, and the bearish (Momentum) convergence realised its aggressiveness on SMRT!
In this relation Creative now looks bad. What make me worry are the ADX already tilted down, so are the Momentum, MACD envelope and RSI!. Have to watch out for the support of $13.50. I will know what to do if it is breached!

SMRT Update


Because today SMRT suddenly rose 3 cents, some blog viewers got excited and asked me to chart it. Here it’s: MACD, RSI, Williams’ R %, ADX, OBV, and Acc/Distrn look good!
The worrying ones: ROC and Momentum are having a Bearish divergence with the Price. As TA rule, in case for such divergences, the price tendency moves in the direction in which the indicator moves. Thus, if the indicator is dropping, and the price of the security is growing, a turnaround of price should be expected.
The Stochastic adds weigh to this bearishness with its tilting crosses (downward). Since this indicator is well respected, in particular in the consolidation area, future movement must be careful monitored. Volume is below 10 period average.
Weekly and Quarterly momentum remain fine. On balance, is a Neutral for the short term and Bullish for the Medium and Long Term.
P/s Chart reading must not be viewed as static in nature. If in any time, the trend of the Momentum is broken, say: it goes upwards, this indicator shall overide other indicators. Therefore, by knowing when the market is going : - into a consolidation period again or reversing the trend, we are able to get out of the trade and get in again at a better price or,perhaps,to reverse our position!

Wednesday, December 07, 2005

StarHub - My Six -Cents Fortune!

What can I say ?

UTAC - To hold or sell, that is a Question!


There are many evidences in the chart that show that the Bull is getting out of steam. The sloped down CMF and the MACD-historgram stops rising and ticks down, these are pre-cursors that show that bears are in control and moving to cash is now the best opinion!
Accumulation/Distribution indicator drops, it means distribution (selling) of the stock, as most of sales takes place during the downward price movement! OBV also confirmed with its tickled down clue!
Worth to note is also the progressive decreases in Volume against Price risngs preceding to today's fall. This usually signifies a Climax top! The Candlestick chart did not look good either. It is getting heavier and heavier with the filled/black candle pattern. Another black candlestick would definitely confirm the start of a (dangerously fear) distribution stage! If this should happen, taking chips off the table is entirely up to YOU!

Monday, December 05, 2005

StarHub (T54) - That Shining Star!


The Good News and the Bad News. The Cons 1st: CMF slightly lowered than the preceding bar, not impressive volume, Williams’ % R alarmed sell signal with its shape turnaround touched down on the critical -20 level and the Accumulation/Distribution wormed a tick down. Now, the Pros: A beautiful MACD envelope with the good double progressive envelope. At a glance we can tell that the 2 signals lines crosses and began to spread and strengthen. It’s a sign that the price momentum may be spurring up! Also the same 2 lines were below the equilibrium level indicating a non- oversold environment with pent-up demand. Corroborating this, the weekly MACD being still in –ve territory is telling us that the same story of its just bottoming, the result is one of the best, and safest, buy signals I know of. Solidified the similar position are a good crossed Stochastics and super RSI 68 north. The D+ ve was marching smartly up. However, its ADX would be better off with a reversed curve. This means the stock is bullish but do not expect instant rally.
Now ,the verdict time.  Before this, I shall try my favourable filters to discern its probability. Let me cast a Fibonacci Band on the last 20 periods. Since the current $1.93 already exceeds the 50% retractment, the time is ripe for a buy. Also today’s close > Yesterday Low. All these are telling us that StarHub is bullish and ready to shine!
I do not bother even to look at the ROC, it is because even a child can tell us that the uptrend is upwards!
Concerning the shortcoming of the Accumulation/Distribution, as long as the OBV is above it, we are definitely safe and sound! On the same vein, Williams’ % R can be easily explained. The stone Caveman already scribbled on the wall: “Fishes swim, Birds fly” and therefore oscillators oscillate; so we shall allow tine to see how Williams’% oscillates first before jump to conclusion (JTC).
Enough being said, it’s time for you to check it out, tweak it to fit your needs and decide for yourself what is best for you!


MY Email : Smartyinvestor@Gmail.com

YahooWeather Bull Fish Business Times TeleText Future Market Investor College Bloomberg NewsStreet Directory Yahoo Financial Google News CNA Financial CPF National Library Board Reuters e-finex HK Market News CommerceAsia ADVFNListed Company