Nera Telcom (N01) as Requested

The Good
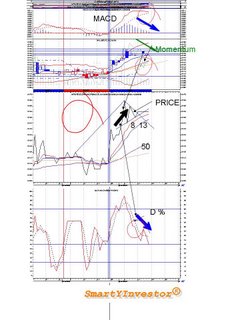
Since there is only 1 good thing to talk about this share let’s start with it first. This is the Moving Averages (MA). Throwing a net of 5, 13, 50 EMA, catches the trend quite easily. From the chart above, Dead Cross has not been affected and price still above the 50 EMA. These are telling us that currently short trend is going to be neutral or bad and mid and long uptrend are still intact (uptrend). We can clearly see the curling of the 5 EMA (red) and its narrowing down towards the 13 EMA (blue).
The Not so Bad
On the neutral side, the stalling begins from the RSI flat at 60. Accumulation/OBV and ADX though still up was clammed by equally flat D+ and D-.
The Ugly
And now the worst scenarios: threatening the downfall were William % R (-25) and Stochastic negatively crossed at -40.
Since 7 Dec 2005 MADCH has been deteriorated. 8 bars/envelopes have been gunned down progressively. This is telling us the spread between the two MACD lines was narrowing, the positive relationship weakened and surely going to be out of gas!
In searching clues for confirmation, the (slow Stochastic slow D% and Momentum)’s bearish divergence against the Price cannot escape my scrutiny. As mentioned before, in the fate like this, the expected outcome would be Price falls in the direction of the divergences.
And now is the time to torch the path and see is there any light at the end of the Tunnel! Candles in hands, we can see, after 5 Dec 2005, the subsequent, 9 periods are in Consolidation stage. According to Candlestick’s theory, another 6 similar inactiveness will exhaust the bull, and the support level of $0.45 shall be hammered through. And that’s theory. However, cemented this theory was the evidence of the last 5 riveting at that support level. Again, may I ask what outcome you can imagine? My hunch is that if the resistance of $0.465 is not pierced through, reversal shall happen! Why ? : the Dominant Shaven white Candle on the 5th instant is significant in deciding the future of this stock. This is Candlestick theory of the so called in between candles.
Sidetrack a bit. They used to ask me as why TA Analysts are better off than those reading the Analysis. I can only say that: “Technical Indicators are the past- the history, so understanding in and out of the chart is the just the beginning of the beginning! It’s just what happened before! A shrewd TA Analyst will know “what the indicator will do before the indicator actually does it!”
0 Comments:
Post a Comment
<< Home