Wednesday, November 30, 2005

It's time to average up SPH (T39)


It’s time now to average up SPH.
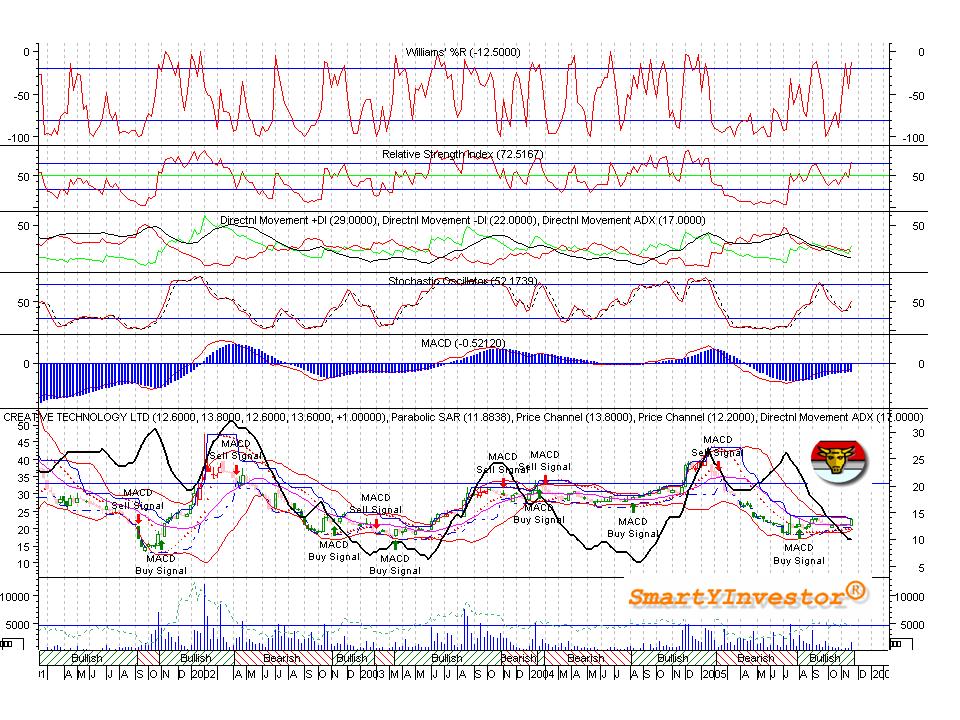
Rational: (1) Inevitable reversal –MACD daily envelope divergence against price
(2) Touches 20%, a good probability of going to 40%
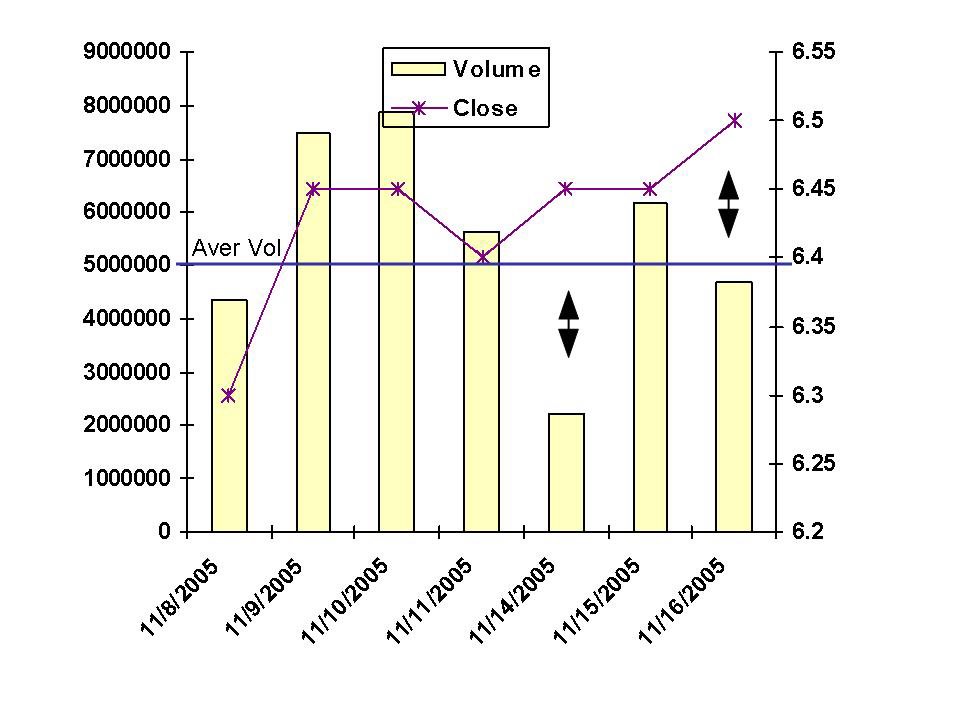
(3) Crescendos of volume, clues of increased interest

SingTel Target Price


This morning 12 mil "Buy" shares traded within 5 mins in mere 2 transactions. And for those strong hand still with me let talk about probability and ideal TP. As (1), if fund is coming and from 20% to 40% is high probability. Already attained , next what is TP . Hmm.... as in (2) 70% retractment($2.68) is good enough and should be attainable

Tuesday, November 29, 2005

SingTel TAs Wise Update


The fact that we use TA is to neutralize our emotion against speculative noises. And if we have no confidence of ourselves and talk too much of this”if” and that “if not”, we might as well play by our ears!. The case in point is this morning, a shrewd momentum trader could have benefited from the range of 4 ticks from (2.45 to 2.49), if he believed yesterday’s good TAs!.
That being said, let’s analyse today TAs!
The TAs have certainly deteriorated. Many –ve points now surfaced. A volume surged and ended with a lower closing price smelled trouble is near. RSI in danger of overbought with plunging curve. Both OBV and the long wick on top of the candlestick evidenced that the bear is now in control. I still do not have my Golden Cross of the MAs that I was asking for so as to reconfirm its upside sustainability.
In balance the MACD envelope is still standing tall against its preceding one and the ADX still upside along with the D still positively placed.
Conclusion: Neutral in short term.

Answer to CNA Forum on SingTel


Sorry to say, I can’t tell you when to buy or when to sell. My information can only help you how to figure out the market and its stock mainly base on TAs and its speculative stand.  Your risk profile and what type of trader you are; is important to deal with this type opportunity.
“Singapore Telecom end-Sept regional mobile subscribers 74 mln vs 56 mln”: and yet the market was not happy with it and now suddenly new structure of management and investors responded greedily, especially the big one. See Market is irrational and therefore very educated and logical person with excited emotion surely will lose money in the market.
Again I mention, sentiment, flow-of-funds and market structure must be in tune to make money. And because of this type of complication, imbalance and inefficiency occurred- this is opportunity!
See today, at $2.43, million of shares per trade done, so you need gut and quickness of your finger to capitalize on it.
To be frank, nobody will know what will happen to the stock tomorrow only after 5:00 pm. But with hard work, the odd is with you!

Monday, November 28, 2005

SingTel (T48) TA Wise


The 15 DMA was converging towards the 45 DMA and an inevitable cross is coming. This is a positive thing to see. The price in a form of a long white candlestick had already broken the Upper Bollinger Band thus spreading it.  The MACD signal had crossed the zero line. Corroborating into the bullish territory was the MACD histogram bar, much higher than the preceding bars; telling us the spread between the two  MACD lines were widening, that the positive relationship was strengthening.
Stochastics crossed and headed north for a buy signal. RSI has risen with a very steep gradient and touched 60. ADX had curled upwards with D positively placed and marched shapely north. Also the OBV showed a good tilt upwards suggesting buying volume very much stronger than selling volume.
P/s The near resistance is $2.50 and the subsequent resitance obtainable is $2.59 and that is only 50% retractment from recent peak and trough.

On SingTel - What a Pay Day!


"Watch out for the crosses of the Stochastic (chart shown likely crossing soon), Momentum tilt up and ADX curls up. Do not miss this one when it sprouts out of the consolidation. I bet it would be rosy and sweet as the upside is the type that makes trader sits on huge profit!"The Above is what I mentioned on the 24 Nov 2005 in my blog. All happened and I do what I have to do! Please don't ask how much I have brought, it is huge sum and huge gain!
So, TAs is importance and News is importance also.
I don't spend so much time for free! Meanings homeworks count and will certainly be rewarded!

Sunday, November 27, 2005

Strategy to "time entry" for FUYU


Again, A friend had asked me to time FUYU for him. Meanings of his asking is “Is it the time now to buy and if not when? and  if possible a complete trading plan”.
I like to use Continuous Triangle and Fibonacci Retractment as Guide.
The key here to wait, not to dive in immediately after a dangerous Breakout for fear of a so called “Shake Up before Breakdown – A Fake Breakout! Wait for 3 further ticks lapse to ascertain its stability.  Checking Volume/Price sync is equally important. Assuming it pull back with good Volume/Price sync; and assume the entry  price then is $0.495, the plan is as above.
NB: This strategy is for Fair Heart & in mediocre market only. If market is good just dive IN!

Saturday, November 26, 2005

FUYU Vs MEIBAN (The Plastic War)


It is up to You!

Could Santa brings RallY this X 'mas?


A Picture that paints a Thousand Words.

MMI - In Uptrend?


Answer to CNA Forum enquiry: Based on the Regression Theory, MMI is currently already in the uptrend. Been in this trend for the past 10 periods. However, there seems to be some Volume Quality Problem. In a genuine and continuing uptrend, rising price must be in sync with rising volume to keep its sustainability. Overall OK!

Friday, November 25, 2005

Fuyu (F13) - Strong and Attractive ?


Fuyu (1) has been on the downtrend since its peak( $0.635) in mid July 2005. Currently retraced approx 30% and pierced through (2) the Price Channel Resistance level @ $0.495. My experience tell  me that stock that rise 20% within 4 to 6 weeks will have high tendency to accelerate another 20% without much obstacle. That is at $.0.52. When that is cleared we should see the next resistance level @ $0.535 which also coincides with the 50% Retracetment. Level (3).  OBV (4) is still on uptrend confirming Accum/Distrn (5); this means the accumulation phase is well and still alive! The volume today at 1.8 mil is the highest relative to 0.4 mil and 0.6 mil of the 10 period average and the 50 period average respectively.
Fundamentally, @ 8 X FY05 EPS, and 1.1 X FY05NTA, Fuyu appears undervalued and attractive!

Thursday, November 24, 2005

SingTel (T48) - Update


A Good Stock with bad publicity! Of course I do not have a “crystal ball” but I can read chart well! I like the RSI a lot, i.e.   it crossed the 50 and smartly tilted up. All other TA indicators are prefect and well.
To me, near resistance is $2.43 and the next resistance is $2.45. This coincides with retractment of 23.8%. To be conservative, watch out for the crosses of the Stochastic (chart shown likely crossing soon), Momentum tilt up and ADX curls up. Do not miss this one when it sprouts out of the consolidation. I bet it would be rosy and sweet as the upside is the type that makes trader sits on huge profit!

What time is it ? - 3rd Average Up Time for UTAC


So, therefore those Gurus who spent so much time cannot be wrong after all. It is said " Never Average Down but Always Average Up when the Window of Opportunity is there!"

Creative (C76) - Are you still Beautiful or Shy?


Although Volume has waned and a Doji has formed, the Momentum and the rest of TAs still look as beautiful as ever! As most Breakouts, short term is Overbrought. However, the Bullish Intermediate term still intact. Scrutinzing the Doji will tell us thatthe Bull is still very much in control as the wick is longer at the bottom.

When entering a Trade, remember what I said on the 14 Nov 2005


At Point (2) on opening, many overnight buyers will sell to take profit. This is technically known as “Graying the Opening”. Simultaneously, at the same point, our Punter friends will surely and secretly shorting it. The so called “Shorting the Gap”. So what happen? Supply spurred upwards. Of course, naturally price will sink. But, it’s all hidden!!  If you are really an amateur, you will surely buy at (2A) due to “Greed” in hope of profit at (4). Sadly, it will drop and drop to (3A)! Beginners will due to “Fear” dump the share as it looks like nose driving to (3B). Thus, they will be nursing the wounds and scratching their heads in wonder!Professional, on the other hand, will slowly and patiently wait for (3A)-technically called a “pull back”- also meaning: “show hand to buy “and take profit by selling at (5). That is to say changing hands – Strong hands take over from the weak hands!
IN DOUBT DO NOTHING!!!

Wednesday, November 23, 2005

SMRT (S53) - Update


Another beautiful chart is SMRT. Bollinger Band spread and also a high volume day. Almost 4 mil today over 2.56 mil (10 period average). Intraday chart looked positive right from the start.! Also large buyer at last min – i.e. bullish for tomorrow!
N/B Please also read by 1st posting on the same subject dated 11 Nov 2005.

Creative (C76 ) - A Perfect Chart!


Creative (C76) is now having the best chart pattern! You name it! (Accum/Distri/OBV) have huge growth potential because it is at the bottom and tilting up, ROC, and all those you can see for yourself in the chart above are perfect!. No matter how I test it: be it Bill William Profitunity, MACD expert advisor, etc and etc; of which my software has, all turned out bullish! Volume today (1.68 mil) almost double the 10 period average (0.99mil) Using Price Channel as guide: the next sub and main resistance is $14.2 and $17.2 respectively. Under this mouth-watering scenario, which trader worth his name do not has his adrenaline rush into him after the sight of it?

MMI (M29) - In answer to Mr Tran


In answer to Mr. Tran, I took the liberty to have a close analysis.
CMF on top of equilibrium, ROC tilting up, Acc/Distrn and OBV both fine and up.  Also William %R highest on the band and tilting up.
The changing patterns that even the most critical and conservative traders hoped for is now materialized! That is D just positively placed. . MACD up and crossed the zero line. The volume already boosted up to 6 folds from yesterday to 6.46 mil. Sub-Resistance broken. SAR just depicted the 1st dot of bullish reversal. Furthermore, volume rose in tandem with price means: strong conviction and bullish days ahead can be anticipated. Even the Equivolume Shape (inset) reveals strong commitment on the side of the Bull. In sum, an excellent pattern to trade in!

Tuesday, November 22, 2005

MMI - Updated


Analyzing the Intraday Chart, the Day trader, if he is bullish with current environment, would normally enter trade at after point (1) when SAR reversed green. A night trader would be better off entering the trade at point (2) after sighting good MACD and the instantaneous last minute uplift. From the chart with the RSI tumbled: to me the chart could have been wrong, hence, I would ignore it!
Basically, I’m a Swing trader; of course, I must admit there are exceptions like prior/after earning report day/new (good or bad). As such, I find the situation now still unexciting to enter trade for the following reasons:
Although, I must concur that the medium and long term would be expected to bullish, I’m still pretty skeptical of the near term. At (point 3 magnified from point 5), the volume increase was not aggressive enough for the 1.5 cents rise. Relatively only 1.02mil over the 10 periods average of 2.09(half only) To me, it is a mini uplift with feeble leg.!
I shall not stop Day trader from planning to trade tomorrow as the probability of uptrend is high based on (point 2 – upturn) in the intraday chart and point (4) in the daily chart as a white candlestick already over shadowed the previous black one!

MMI (M29) TAs Wise


TA –wise, we know that MMI is now consolidating along with its very suggestive low volume. Accumulation/distribution, OBV, ADX, Stochactics and the Momentum are currently in an unfavourable to trade zone!
However, a peer at the Weekly chart confirms that it is now in MACD bearish stage in contrast with the Daily Chart’s MACD bull call, 13 period ago. This is telling us that there is a lot of upside potential soon. The significant resistance and the consolidating resistance are $0.60(touches twice) and $0.55 respectively. Decision to enter trade is better to  be leaning more to these breakthroughs and the current Tech stock’s market sentiment!

Monday, November 21, 2005

STI - Today


STI today was up in the morning and lost its gain before the break at 12:30pm. After which, a desperate attempt to recover ended minus 10.70 points (2282.50). Decliners over shadowed advancers 304 to 170 along with low volume of 683 mil.
No victory can be identified from distinct sector. But among the losers were the reit, hammered by fear of interest hike.
Losers in focus were Oil related company, SembCorp Marine- was down 2.2% at S$2.61 and SPC also dipped 2cents to $4.50. Conversely, the outstanding winner was Chartered , rose to 2 cents to $1.19.
As if in answer to my previous postings Cosco downed 4cents ($2.20), Magnecomp downed 1.5cents ($0.935), ST Eng unchanged ($2.68) and UTAC up 1cent ($0.665). It really convinced us what the TAs can do!
Based on today’s performance, tomorrow  may not be a good day again! But who know?

Sunday, November 20, 2005

Cosco (C21) - Meaty Vs Risky!


At a look of it, no voracious trader would like to let Cosco(C21) go without a fight! The reasons are very simple. Daily Stochastic is now at the best position that anyone would like to enter trade. It has just crossed together with a upturn from the low end of its range;  and the RSI has just formed a mini double bottom and smartly bounced upwards again. In concert, MACD triggered off a buy 10 periods ago. CMF seems resilient against my manipulations: be it 5days or 14 days in parameter - both tests shown +ve envelope just surfaced!  Both Accumulation/Distribution chart and OBV are still upwards in tandem; these combinations positively alleviate the fear of its often intricate tussle.
However, in my sense, there are a few concerns as follows:
Price ROC although on its upturn was crossed by the MA that I used to confirm its robustness. This is a “show hand” of resistance to its potential accuracy. ADX flattened and D negatively placed, indicative of a mellowed downtrend. No immediate rally can be envisaged in this environment in near term.
Conversely, most indicators in the weekly chart look unfavourable. Furthermore, even in the daily chart I have spotted certain patterns not conducive enough to load up now. Namely: the Williams’ % R was frightening, tumbled towards the low band, relative low volume and eerie envelopes of MA within the departing MACD as shown in Chart above.
To me, follow the market is not enough, we ought to see what is coming!
So, let’s conjure the most likely outcomes:
As in the Chart (1) Consolidation, (2) Complete the Double Bottom and (3) an upturn
Base solely on TAs, either (1) and (2) can be envisaged. But with the impending urbanization of China along with its enhanced globalization, Cosco will surely prosperous in the long term perspective.
All said, the rest is up to you. But remember, in doubt, do nothing!

MagneComp (M14) - A Real Gem?


Another stock that is very mouth-watering to me is MegaCom.
The blue patch in the chart above indicates Bollinger Band up,out and spread; whiltst the red patch did not show me the volume that goes with the gap up!

Saturday, November 19, 2005

UTAC - Everything is Beautiful !


A picture that launches a thousand ships!
2nd average up time?

Sharing the Rating System Used for ST Eng on The 31st Oct 2005


How I spotted ST Eng on the 31 OCT 2005
The above table was posted on the same day in my blog.

ST Eng (S63) - The Breakthrough is Double Eged Sword?


A reader had requested me to assist her in answering her concern on ST Eng. She know that STEng breakout today but too afraid to buy as she is worried that it could be Distribution stage and immediately after purchase the price can turn against her since most breakouts are usually overbrought and looked scary!.
I do a complete analysis and this is my finding and advise to her!
I cannot find any fault with any major indicators(RSI, MACD,ROC,Willianm% R, Stochastic and the list go on..) as all were more than perfect to me.
To alleviate her fear, I scrutinize the Accumulation/Distribution and confirmed that it is pointing towards the Accumulation Phase. Even OBV confirmed this with its +ve gradient upwards.
The weekly chart is used to grasp the big picture. A double bottom (Weekly Chart 1) seem to have formed. However, there is still gap between the neckline and the ending of the 2nd bottom. This is telling us that there is still a gray area. It could be a Fake Breakthrough (Daily wise)! As such confirmation is necessary. So how?
My advice is to wait! Then when?  I prefer to wait for pullback ( so called correction in Markup/Accumulation). In the 2nd Daily Chart point 1 to 2: watch for high volume, conversely in Point 2 to 3: for low volume; this tends to further confirm a temporary reaction to a reversal of trend. Dive in after pattern exhibited as planed. Please note this is based on “probable” and not “guarantee” sure fire!

Friday, November 18, 2005

STI -Today


Today, the STI made a valiant effort at challenging the psychological 2280 mark and did a breakthrough(31.71pts gain)! This time round, volume was a convincingly heavy, a 988mil against the previously 700 mils. Also gainers (368) widened losers (163) significantly.  In the candlestick view, it would be a 3 white soldiers heralding a start of a potential rally to come!. In contrast to yesterday, it was smooth sailing from the start: an “up and up and away” motion. That is what I used to say: “when it comes to stock market, things are seldom what they seem!”
With these weighty gains,all sectors excelled. Blue Chip, Banks, Tech, Property and Oil related counters went up!
What more can I ask for?  Is your money ready on Monday?


Celebration & Celebration - Cheers!!


On Channel NewsAsia today:
Thanks to all my readers for taking the time to follow my Blog. I shall try to make my blog a "Growing Money" one to everyone. Hopefully you are able to read in between the lines with a factual mind and serene heart!
http://ongsmart.blogspot.com/
Congratulations and CHEERS!!

Jurong Tech (J09) - A Special Request to analyse by A Reader


From the weekly chart, the long term trend line still pretty intact. It started from May 2004. This ended at $1.70 which was a powerful indicator of its support level, which had been tested twice. On the other end of the spectrum, the resistance level stands at $2.20.
Coming down to the medium pattern, the ROC and the Momentum were tilting down suggestive of a bearish environment.
Finally, in the short term, the Stochastic rebounded off its equilibrium line and RSI seemed pretty steady with +ve gradient towards 42. We can tell that these +ve effects would be dented and could not remain neutral for the following averse symptoms showed:
ADX flattened with D-ve down and D+ve up. That would seem good! But on scrutiny the D+ happened to be below D- & that was bearish! MACD looked worrying due to its uncrossed and way below the zero line. ROC though up was minus 4.
From the Big Picture, A Single Top already formed and it survived a Fake Breakdown few periods ago. The recent 2 period was a powerful White Candlestick, dramatized a BULL in action and would have been heralding his victory if not for the Doji Star. This would normally indicate exhaustion and spell a potential reversal! To further show strength in this direction was the Volume Chart confirming a low price and low volume scenario.
But please bear in mind; you need integrated components to affect the market. Namely: Fund, Institutional Buyer (Buyer/Seller Queue), Market Sentiment (Analyst report/News) & Market Structure (TA).
The rest is up to you to conjure!

Thursday, November 17, 2005

STI - Today


STI went underwater at the early morning and maintained so until the final hour. It ended 7 point (2,254.46) higher with low volume (697 mil) The 5 letters word that begins and ends with S depicts the mood precisely: “SUCKS”.
Property counters were a mixed bag – KeppeLand up 6cents ($3.80), Captaland flat ($3.32), Wing Tai down 3 cents ($1.27) and All Green up 1 cent ($1.33).
Banks exhibited similar and undulating figures: OCBC down 5cents ($6.45), DBS stayed flat ($15.90) and UOB ($14.40) gained 10cents.
Kepcorp staged a stellar performance by soaring 50 cents ($11.60) on Analyst good report of Highest book order.  Semb Corp. along with its subsidiary SembMarine 7 cents ($2.65) and 9 cents ($2.62).
Bigger Tech stocks seemed resilient, Chartered and Statschp closed flat, while the penny stocks had its day: Magnecomp up 6cents ($0.92) and HI-P also raised 7cents ($1, 52)
Helping to boost the STI was SPH up 8cents ($4.52) with 6 mil trades changed hands.
Being optimistic again, I stress: Gary Smith in the book: ”How I Trade For a Living”, paints a trading scenario that he likes to trade: “V bottom upside reversal –late-day upside price surge”. Today’s chart as shown above reflected  this similarity. Again, I hope he is right and tomorrow will be bullish!

OCBC (O39) - To invest now?


All major indicators are beautiful!, You name it: RSI, ADX, MACD, Stochastic, Willian % R, Price ROC. A bit worrying is the volume did not increase as price went up. Nevertheless,the Bollinger Band is also started to spread outwards now - a sign of a potential ride along the upper band. Watch out for a volume boost to dive in anytime now to capture the first cream of this Financial Gem!
You may not believe it, but I have "deep pocket" friends who got RICH just by accumulating and investing only in OCBC & SPH over the years!

Wednesday, November 16, 2005

ElectroTech (E28) - To Buy or Not to Buy?


  1. Trend is down

  2. No volume

  3. RSI down

  4. Neutral ADX

  5. MACD crosses but still below equilibrium

  6. ROC tipped up but still minus

  7. Accumulation starting stage. Noted without big buyers and high volume to kick start, no rally can be materilised

So, how can it be the time?

STI - Today


Today, the morning session was a soaring one till 10:00 am. After which it was on a long but tight and flat ground range, until the end. STI managed to gain 13.97 points, or 0.6%, to 2254.46. Unimpressively, the volume dropped to 664 million...
All Major Banks were up, probably due to the easing sentiment of previous days’ higher interest rate worry.
Tech shares also reversed and regained yesterday’s losses. Some seasoned traders in the forum also cheered at the sight of institutional buyers into Tech share.
Again, the tango rhythm echoed not only in the Tech sector but also the property & blue chip counters. The so called one step forward two steps back extended to Capitaland, Kepeland,SPH and SMRT. SMRT did well, even blinked upwards 2 cents along with the recent XD not dissipated.
Oil firms were up, with SPC back to $4.6, up 8 cents on volume of 2.64 mil. This exactly balances up the loss equation of 22 cents 2 days ago;striking my anticipation of a “ground zero” scenario.
One noteworthy penny stock, Electro Tech seemed pretty strong and held steady all day. It raised 1.5cents
Hopefully, today’s performance can continue and its patched tight range (as shown in chart above) could be a window of opportunity in the coming days. Tight range, the longer the better, and when it breaks through, the volatility would be many times its previous range height. So, get your money ready and let’s rally together!

Important Date

STI - Kelive View

Tuesday, November 15, 2005

Understanding Market Behaviour of SingTel (Today)


  1. Singtel Opened @ $2.40 and then went down to $2.39 @ point 2

  2. A lots of buyers who have positioned wrong at point 1 want out due to STI bearish and emotionally unhappy

  3. Supply and demand exchanged and price rose to $2.40 again. At this point, previous unhappy traders bailed out and possible short covering of other existing buyers. This increased the supply and drove price down to $2.39 @ point 4

  4. Formation of Resistance ($2.40) and Support ($2.39) occurred. This is the so called trading range. If market looks bearish, a slight drop will drive it downward.

  5. So it did. ($2.38) occurred. And again it drove down to close @ $2.37 for the same rational!
N/B: Only looking at the big picture. Slight spike and brief trading @ $2.42 and $2.36 (noise) are not considered due to low trading volume.

STI - Today


Another day of bearish sentiment. Right from the start in the morning, STI sunk miserably. The afternoon was a desperate attempt to even up but ended in a consolidation down by 13.66 points to 2,240.49 points. Declines outweighed advances 351 to 137, along with a 786.1 million shares exchanging hands. Again, nobody knows the reasons behind this downfall but many dealers blamed it on the rising lending rates and the uncertainty behind the upcoming GPD.
Banks and Tech shares were again in the losers list. Property counters shared similar faith,with Captialand leading the fall, down by 8 cents to $3.26 on volume of 19.4 mil.
One divergence from Yesterday was most Blue Chips also succumbed to the downside pressure. Such includes: SMRT, SPH and ComfortDelgro. It was really the worst market to be in. Meaning: one day, we see the Blue Chip or the Tech share up and the next day it lose its gain back to ground zero!
SPC seemed aggressive today, gained what have been lost yesterday but still having a minus equation (Loss: 22cents Gain : 14 cents). Hope it is not one of that Distribution/Markdown rebound of which the end result is even more fatal! Who dare say right or wrong now? The key here, remember and remember it hard is “To walk away solvent”. No right or wrong: to stock market, the egoist is certainly right all the times, but DEAD right!
From the chart above, the red rectangular box depicts consolidation in the tail end pattern. Thus it is most likely to spill over tomorrow. Meaning, a bearish tomorrow. I certainly like to lose my egotism here!

To Crytal Ball SingTel (T48)


One of the viewer of this blog has requested me to evaluate SingTel.
I ran a simple and quick Go and No Go check and here is the verdict!
1. Volume synch – Price down and high volume up: a signal of more sellers than buyers   and an  inevitable short term downtrend.
2. 100 EMA(blue) crosses 50 EMA(red). Not a good signal
3. ADX down and D+ and D- down, a non directionless trend
4. RSI –Down from 52 to 48
Verdict: No Go

Monday, November 14, 2005

STI - today


STI looked bad today! With a slight spur up of several points in the opening, the rest was downhill right till the trading session close. Needless to say, the Top Volume Stocks were once again coated RED! These remained us of the similar behavior of STI on the 19th Oct 2005. Situation today looked more severe than that day due to the reason which during then it was expected to be swayed by USA weighing us down. But latest USA in this instant was favorable with Dow & Nasdaq both making gain. This means Singapore market is getting more and more nervous, without any catalyst to propel forward. STI dipped 11.88 point (2,254.15). Ratio of decline Vs advance widened 387 and 138 respectively.
Banks was neutral on the average, DBS (XD) down, UOB maintained and OCBC up. Tech sectors and Property on the average finished in the red.Oil companies were not spared: Keppel Corp, Pearl Enegry, Semb Marine, Sem Corp and etc, etc. Strikingly,more precipitous was again SPC plummeted 22 cents to a mere $4.38. This, incidentally coincidented with TAs that I have drawn; screaming its doomday a few sessions ago! The stocks that caught my eyes, the so called “strong stock in weak market” were SPH, ComgortDelgro, ST Eng and Yellow Pages. Incidentally, there are blue chips with high Dividend yield. My recent call on "Where to put your Money Next" is starting to backup with these evidences! In retrospect:the rotational strategy is "to seek Blue Chip with high Yield" when Bear Market persisted".
All in all, the scenario was from a feeble rose, great yawn and ended a nasty fall!
All not lost, hope the ending thrust of a doji(shown in Chart above) with long bottom shadow shall bring us a dragonfly tomorrow!

ComfortDegro Update - Do Not Cross


Whilst I’m writing STI dropped 3 points, CNBC is screaming that Oil is up again and also ComfortDegro did not response to what I’ve planned. As such, would shelf my plan and stay sideline. Market seems nervous and it ought to be depended on many aspects. Namely: Fund flow, sentiment, interest and market structure indicators.
However, I must apologies for my previous wrong judgment based solely on my experience related to “Bullish Divergence” of Analyst forecasted earning. Nevertheless, the concept to profit on Good News still remains unchanged.

Sunday, November 13, 2005

As Requested - Rational for ComfortDelGro's Plan

Rational for ComfortDelgro’s Plan
At Point (2) on opening, many overnight buyers will sell to take profit. This is technically known as “Graying the Opening”. Simultaneously, at the same point, our Punter friends will surely and secretly shorting it. The so called “Shorting the Gap”. So what happen? Supply spurred upwards. Of course, naturally price will sink. But, it’s all hidden!!  If you are really an amateur, you will surely buy at (2A) due to “Greed” in hope of profit at (4). Sadly, it will drop and drop to (3A)! Beginners will due to “Fear” dump the share as it looks like nose driving to (3B). Thus, they will be nursing the wounds and scratching their heads in wonder!
Professional, on the other hand, will slowly and patiently wait for (3A)-technically called a “pull back”- also meaning: “show hand to buy “and take profit by selling at (5). That is to say changing hands – Strong hands take over from the weak hands!

ComfortDelGro - My Trading Plan Tomorrow!


For Short Trader
Short @ (2)
Cover @ (3A)
_________________
For Normal Trader
Buy @ (3A)
Sell @ (5)
_________________

Short, Simple & Sweet (3S)

Saturday, November 12, 2005

Technically, Chuan Hup is ..........


Based solely on the TAs, Chuan Hup is poised towards a better uplift ahead. As in Chart above,  (1) A Bullish Harami Cross sighted. (2)In the Daily chart, we can anticipate a potential upside judging from its closing towards a Single Bottom!  With ADX softened and  D positively placed, uptrend looks imminent. RSI tilted up and already touched the psychological bullish line (50).

ComfortDelGro - A Divergence of Analyst Forcast

Despite the forcast of a loss in 3rd Qtr earning, Comfort's earning was lifted by 1.2% ($50Mil). This is a bullish divergence that surely spike its Monday's morning price. Retailer Trader who did not heed my indication to buy last week,should keep their heads cold then, as it would be too late to react!
Punters may consider shorting during its peak in the morning and remember to buy it back on pull back!
(This is not a call to buy/sell,just sharing experiences! Buy/Sell at your own risk!)

Friday, November 11, 2005

SMRT - Strike while the Iron is Hot?


Quarterly Momentum has been flat, but Quarterly ROC Zig Zag ( small up-down-up) ended at 55. This should be resolved into the upside.
Short term wise, the previous 2 non-synced  Volume/Price pattern was finally changed. Today the Volume rose in concert with the Price.  A sign that there was more buying for the stock than there was selling. This commitment by buyers in an uptrend mood was evidenced in the EquiVolume  chart as shown. The SAR reversal pattern, together with a breakout by the White Candle  bombarding the top Price Channel, added convictions. Techncially,RSI was up and at 58 and D just turned positively placed with ADX eased - meaning uptrend is going to be strong. Interest exhibited strength relatively: Today’s 6.35 mil volume was almost doubling the last 10 period average of 3.3 mil.
Upside potential looks pretty good as SMRT is currently only 0.5% above the 200 MA
Based on the Price Channel Theory, current Support is $1.00 and Resistance is $1.03. Today’s $1.04 already cleared this Resistance level. Also today’s High of $1.60 is telling us that a TP of  $1.14 can be envisaged. After all, this is just in the middle of the magic Fibonacci Retracement (50% - 61.8%).


MY Email : Smartyinvestor@Gmail.com

YahooWeather Bull Fish Business Times TeleText Future Market Investor College Bloomberg NewsStreet Directory Yahoo Financial Google News CNA Financial CPF National Library Board Reuters e-finex HK Market News CommerceAsia ADVFNListed Company