ST Eng (S63) - The Breakthrough is Double Eged Sword?


A reader had requested me to assist her in answering her concern on ST Eng. She know that STEng breakout today but too afraid to buy as she is worried that it could be Distribution stage and immediately after purchase the price can turn against her since most breakouts are usually overbrought and looked scary!.
I do a complete analysis and this is my finding and advise to her!
I cannot find any fault with any major indicators(RSI, MACD,ROC,Willianm% R, Stochastic and the list go on..) as all were more than perfect to me.
To alleviate her fear, I scrutinize the Accumulation/Distribution and confirmed that it is pointing towards the Accumulation Phase. Even OBV confirmed this with its +ve gradient upwards.
The weekly chart is used to grasp the big picture. A double bottom (Weekly Chart 1) seem to have formed. However, there is still gap between the neckline and the ending of the 2nd bottom. This is telling us that there is still a gray area. It could be a Fake Breakthrough (Daily wise)! As such confirmation is necessary. So how?
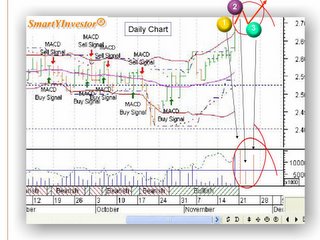
My advice is to wait! Then when? I prefer to wait for pullback ( so called correction in Markup/Accumulation). In the 2nd Daily Chart point 1 to 2: watch for high volume, conversely in Point 2 to 3: for low volume; this tends to further confirm a temporary reaction to a reversal of trend. Dive in after pattern exhibited as planed. Please note this is based on “probable” and not “guarantee” sure fire!
0 Comments:
Post a Comment
<< Home