Tuesday, February 28, 2006

STI - Today

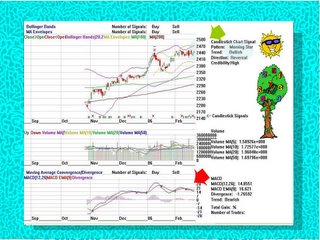
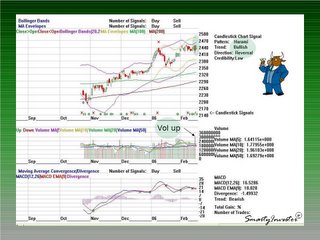
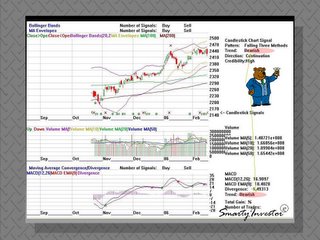
Today STI strikes my forcasted lottery (2490)on the 15th Jan Last Posting on STI 15-Jan-2006 Although the timing is delayed, the concept is acheived,(Intraday STI 2462 - 2490 )
Tomorrow, Newspapers will have STI recorded highest within 6 years? But what does this means to the retail traders like us. Very choppy session seriously down in the morning; piggy backed Japan's fall and crept up in the afternoon. China plays (except for a few stocks) , down nerviously. Gainers were the banks, with the except of OCBC, downed by 5 cents, even with good results. Perhaps 12 cents dividend is not enough.

Monday, February 27, 2006

Asia Power as Requested


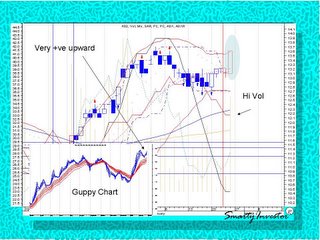
From the Guppy Chart, there is nothing that can stop the up momentum. However, on scrutiny at the ADX (5 day) chart, something betrayed this notion. In particular, the ADX at 62, coupled with the D+ already hooked down; this to me, seemed to confirm the CCI as overbought (at 140) which mimicked similar hooked down pattern. The sudden drop in volume together with the reduced top shadowed White Candle emphasized Bears are already to move in with force.
There again, since it’s only 30% above 200MDA, it would appear that A03 is not so extended after all.
In conclusion, it could still have its puffs and whether it is a last puff or not, it is yet to be seen. Therefore, the best strategy is ride on the uptrend until, the downtrend is breached!

STI -Today


As I’ve expected Keppel Corp
surged 30cents. However, most China stocks seemed to have mellowed. Banks were the big winners. STI today had breached the 2475 barrier; which means better days ahead. DBS View is Targetted as 2560 on the way!

Sunday, February 26, 2006

Global Voice (H23) - Your Health!


As I said, this is a Growth Stock and can't be punted. For those who have punted and asked for my view, this is what I've to say as per chart above. Conversely, I never rule out its growth potential. Key is how market will react to this stock after its coming earning announcement.
P/s This is no inducement to trade but fulfilling a request of my view.

Hongguo (H14) - That Shinning Shoe


Another China/ small cap player. Particularly, the ADX (5day) with the D+ just flipped over positively. The CCI at -12 denotes a non- oversold position shooting up. We also can see the drying up of volume prior to its high volume breakout of the downward channel.
Fundamentally, at 7 X PER on 2006 earning, an ace against most competitors and with at DCF tagged at 44 cents, even conservative trader would be mouth watering now!

Saturday, February 25, 2006

China Paper (C71) - A Paper that shall bring Good Tidings


Beautifful China Play!. Just breakout from its down trend channel. A favourable just cross of 10/30 EMA and the best trampoline action steering off the Guppy mid MAs support. The rest is in the chart: Green means bullish, & Gray means neutral!

SingTel (T48) - Checking its Health!


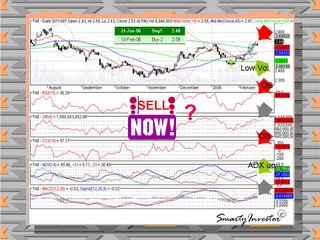
Currently resistance stands at $2.64 and Support at S2.54. Short term trend still intact (means anytime can goes up also)but currently trending down. From the ADX, the probability of near term down is high. I'm a bit ambivalent to enter trade now. So wait and see!. Remember what the Gurus say : "buy on support!"

Keppel Corp (K02) Look like Nothing can stop you from rising!


See the Guppy chart,the high volume and the breached Price Channel! Is it the IR boost?

Thursday, February 23, 2006

" A Breast in hand is worth more than two in a Bra"

The Moral of the story is take profit, as long as it is a profit, take first! especially so in Bear Market. All the small things will add to a big dream, and don't be greedy!. However, in bull market do the reverse, let the profit rides!

Wednesday, February 22, 2006

How I made a small Fortune but Frightened!

Believe it or not, I do it by going against the TA principle. Went in on Bad chart, not following the trend and fishing the bottom. Stocks are: Sing Tel, SPC, DBS, NOL & StarHub. Then, I read the Japanese woman and her principles of buying the cheapest Tofu; I tend to understand it. But she did it in the Bull Market. But now STI is certainly bearish! I’m an afraid because I’m slowly throwing away my TA’s principles and turning to be a Gambler! I surely know the outcome of it. Therefore, I’m now trying to stay away from the market. Why, I cannot be so lucky all the time, as luck has its limit.

Tuesday, February 21, 2006

STI - A Morning Star


China up, Japan up and HK up. Together with a Morning Star sighted, tomorrow will be better! Right?

Monday, February 20, 2006

StarHub (T54) - Look for a Star - A Falling Star


StarHub (T54) looks attractive to me now. Last 2 day’s decline of more than 18 cents (8%) provides good entry opportunity. Its 61.8% retractment from its last peak was $1.97; which already been passed now. I really don’t know what was the reason for the drop, and if it is the M2 World & the Internet TV matters, certainly StarHub has been over punished. In fact, the recent Budget announcement should on contrary benefited StarHub most. Anyway, the downside is surely limited to $1.84 which coincided with the 100% retractment; meaning this figure added significance to it as a support level.
The strategy would be risky as we are fishing for the unknown bottom, but as I said the limited downside may warrant the risk taken. Again, the oversold condition seem too good to be missed. To dip toes in the water, we can do a small accumulation first, wait and see, then decide to average up or be a patient sitter for a small baby. Why? If not, you may be surprised when the up shoot do arrive, it comes so fast that the brain and hands are too slow in comparison

Saturday, February 18, 2006

SingTel (T48) - To Sell or Not to Sell?


Fundamentally, SingTel (T48) is cash rich. The price now is certainly propped up by the special dividend of an anticipated 18 cents based on $2.5-$3 billion at hand. Analysts’ TP ranged from $2.75 to $2.88. Then again, now to May, who knows, anytime can happen in the stock market?
Technically, Price looks a bit extended, with 45DMA cut down on its 15DMA peer. Candlestick wise, it is not a good sign to have black Candle after a Doji. RSI and CCI already streaming Overbrought!
On the neutral stand are the MACD and the OBV. In case of the MACD, although the envelope showed deteriorating, and the 2 signals are slowly running out of stream, the picture still looks OK. Similarly OBV’s short trend line is not breached.
On the optimist side, I like the ADX which is up 30.7 and the low volume accompanying the price drop.
A decision has to be made, & what is analyzed now can surely be very help on the ground. I've watched closely on the Price Action, and feel that $2.7 resistance is very hard to break. These few prior sessions were the strugglings to maintain at $2.66. So, let’s see what’s next?
In retrospect, my previous calls on the 21Jan 2006 & subsquently on the 6 Feb 2006:
It's Average up Time
Buying for a Song
OCBC Analyst's Report

Global Voice (H23) - Still vocal on Global Voice?


11 days ago, I have mentioned on this stock and advised not to punt but buy for growth. This is a junction where the ability to control the emotion will be the greatest asset to have. Let’s not be blinded by the recent bearish sentiment of the market and take an objective look at the current situation.
Before that, let me elaborate on it fundamentally. This stock has always been a punter’s paradise, but institutional buyers never like its business model. And the company’s balance sheet has been –ve. But according to Kim Eng, there is great potential ahead. So the purchase is for “growth” in future, not immediate. As I have mentioned in my shout box to a reader: “if you lose patience, you’ll lose money”.
That being said, now we can analyze the probability. From the chart, we can see that, the immediate support of 0.16 has been (or near) tested for more than 10 times. It’s a very strong support, unlikely to be breached easily. OBV has just touches its own trend line but not broken yet. CCI at -94 denotes a much oversold state. Volume low with accompanying low price does not look threatening to me. This is the ideal situation where the Big Boy will gain money by inducing fear to retailer investors. So called shaking off the weak hands and buy it cheap. Nicely put, they cleverly buy on support and make money selling on resistance.
Of course, if the immediate support is breached the next support is 0.12; synced with the reversed amplitude agaisnt the peak of the single top. The choice is also yours!
The Edge (Feb20-26) on Global Voice

Thursday, February 16, 2006

STI -Today


Looking at the intraday on the right sidebar, it would appear that the STI is shaky. As I mentioned yeaterday, one day up and the next down just indicate a nervous market. Despite the gain today, and the good Candlestick of a Bullish Harimi, I still stay cautious. Many factors forthcoming can change the faith of STI. On the upside, the Budget announcment tomorrow and on the downside, US's persistent interest rate hike can swing the bullish upturn dead stone!

Wednesday, February 15, 2006

Semb Kimstran (S52) as Requested


Very bad chart. 15 DMA already cut downward by a Dormant clear shaven Black Candle. OBV and its short term trend already violated. RSI curled down at 48. Furthermore, MACD's 2 signals just -ve rolled over. Togehter with the synced bearish signal Candlestick, it just looks like the momentum of fail will continue!

STI -Today


Against expectation, STI performed badly today. The chart shows badly as above. If we started to have another symptom of 1 day up and next day down, the market is exhibiting its unstability. So it is better to be cautious.

SPC - (S99) - Buying Cheap!


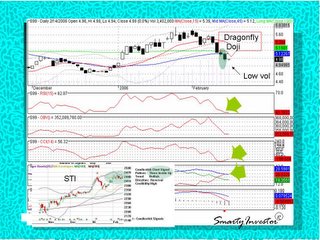
I like SPC (S99) not because the chart is beautiful. It is because I see upcoming bullish potential. From the ADX at 28.9 and curling down, I tend to feel that the downtrend has mellowed. Of course chart don’t lie, particularly the more sensitive Candlestick. So what do we have: It’s up to you to put it, a short tailed Dragonfly Doji, Bullish Harami, or an up and coming Morning Star? They are all bullish in potent. As I‘ve said before, it is so sweet to buy on Oversold condition... So RSI at 40 and CCI curled up at -160 exhibited in concert to confirm it. The current price $4.98 is well supported and particularly so in anticipation of the coming more than 31cents dividend. Thus, currently the price looks cheap. Of course Oil is down now, but it would not be at this level for long. The fact that the current chart suggested good probability of reversal, hence, being an early bird will surely catch the best worm. It is not to say that we can rule out downside, but it would be limited. With the STI currently a bullish 3 Inside Up, and the good feeling of Election Sweeteners to be announced this Friday, timing cannot be better! If I have to grip some, I'll try this one!
Business Times Report

Monday, February 13, 2006

China Flexible Package Holding (C59) has a bad chart


China Flexible Package Holding (C59) has a bad chart. 3 black crows pointing towards a bearish environment. OBV already kissed its trend line and the 15 DMA also violated. ADX curled down, RSI equally bearish and cut crossed the 50 mark MACD also already –ve crossed... The clear cut out pattern happened to be very bearish Double Top. From the chart wise it is unlikely for an upward movement any time soon. Probability of more falls is great!

Saturday, February 11, 2006

DataCraft (D06) - To Buy or not to buy ?


After 12 sessions of upward movement, the chart looks tired and extended. Although, Spinning Top can move either way, I tends to lean more onto the decline. Why? The Spinning Top also looks like Bearish Harimi in concept), current nervous market condition, STI overbought and the following indicators provided clues to confirm its severity in tandem; pointing to the overbought condition! Stochastic @ 80 and –ve crossed, RSI @ 69 and started curling down. However, main uptrend is not violated. This can be seen from the ADX and MACD chart.Better to be on the cautious side; surely, the experienced traders will agree with me, how painfully it will be to err and be caught on the dumping (distribtion)cycle.
FA: I'm sure all the good news had been factored in and in conclusion: if in it already, hold ,and for current sideliners, better to keep hands in pockets now and not on keyboard!

Friday, February 10, 2006

NOL (N03)- Buy on Weakness


NOL (03) looks attractive now after 2 days of sell down amounting to 11 cents loss. This opportunity can be taken due to: 1. After Xd, the dumping was overdone and 2.Again chance to buy strong stock on weak market 3. Shipping could be on the recovery (Shipping recovery ). Based on today’s experience, cycles of upturn are short. Meaning Singaporean goes for small profit and trade on very short period, & also always finding excuse taking small profit. So, our strategy ought to follow. Buy at approx (STI 2350 and Sell at STI 2450). However, this one is exceptional for the above 3 reasons.TA is important, but sometime environment/situation can overwrite if the reasons are valid. Chart wise nothing good to talk about except that OBV trend is not breached. By the way, my thinking is still technically correct: the so called TA's principle of " buying on corrective pullback"!

Thursday, February 09, 2006

STI -Today


Much better than I've expected. Up in the morning and down in the middle and ended slightly above flat.Candlestick- Bullish Homing Pigeon after yesterday's failing evening star.

Wednesday, February 08, 2006

DBS Bank (D05) - Buying Strong Share in Weak Market


I single out DBS not because the Bank has a beautiful chart. Conversely, the chart is far away from it. As far as, the Main trend line and the OBV’s trend line are not breached, this one can be exceptional. Why? Today, downturn across the Asia was led by the Japanese again; this is an opportunity at its best. I see strong support level at $16.20. TP can be met at $17.20, the peak at early Jan 2006. DBS today, down 30 cents provided opportunity for the so called “accumulating strong share in weak market”. Also, UBS Investment is bullish on DBS as benefactor from the anticipated reflating economy. Furthermore, Macquarie is seeing the future in anticipation of the 17th Feb goodies announcement and the unveiling of the Government’s Budget then. They also mentioned capital restricting and the theme that would be expected to shift to property sector once again. All these activities speak well for the Banks

Tuesday, February 07, 2006

Global Testing (G31) as Requested


Global Testing (G31) has beautiful chart. See the mini Double Bottom with the Ascending Triangle? Also the last 7 period Consolidation was breakout today with high volume. All the important indicators indicated in the chart are very expressive of a Bullish environment ahead. These confirmations can be summed as not dangerously overbrought, and a very good upside with good probability of near term upthrust. Fundamentally, G31 has good revenue growth (>5%) and trading at approx 1.4 times(considered good within the same industry) FY2006 P/BV. DMC & Partner is calling a “buy” with TP 41.5 cents within 12 months.

Global Voice (H23) Buying for the Future!


I like Global Voice (H23) now for the following reasons: Recent smart acquisition; more so on the management of cash flow, i.e. its loan management policy and its quick and confident materialization of revenue almost instantly. In research wise,
Henderson Technology Team views “Fibre to Home telecom” as the key driver that could be the impetus for 2006 product cycle of IT spending. Also according to the recent Edge, 2 Analysts are bullish on this frequent Volume topper with Targeted Price as 26 to 28 cents. Chart wise, it really looks good. OBV, CCI and RSI are beautiful, with D+ just moved above its D- , and also not over brought. This is the stock that I single out to gain reward not as of now, but for future. So don’t punt on this but invest to get better gain!

Monday, February 06, 2006

SingTel (T48) - It's Average up time!


Anyway you tweak it, SingTel will turn out good! Inverted Head and Shoudlers or a Cup & handle, you name it!. I really like the volume dried up as price went down and the increasing volume with today’s climb. The 8 and 13 DMA were converging towards a roll over. This is a “Golden Cross “ to buy. MACD signals just crossed but still in –ve territory is telling us a good upside can be envisaged. In fact, this is my favourable point to pile up! The Candlestick pattern is now exhibiting a “Engulfing Bull”. This is suggesting of a price surge as buyer now move in with enthusiasm. The OBV is continuing to make higher low and RSI halted its decent and now curled up at 54. Both tell in concert that probability of upside is great. Earning report on Wednesday and huge hot cash in hand, to me there is no better time than now!

Kim Eng's View

My Previous Posting


P/s CNA News Lastest: SingTel won legal case against StarHub

Sunday, February 05, 2006

STI - Doji, Doji, what do you mean?


A couple of readers had written to me to explain in detail the concern of these double doji. For those professionals, kindly bear with me for awhile.
Conversely, I will not dwell on the double Doji (FYI Doji got no plural), as per se. I look out for sign to unearth whether it is corrective down or a long term violation of the main trend (true reversal)
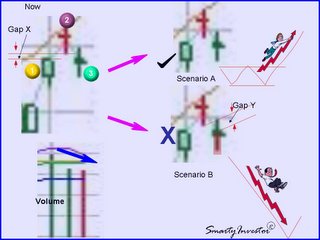
Let’s look at the chart in detail: (1) to (2) means impending reversal, i.e. alert/caution only especially after an extended uptrend.
The Gap X and Gap Y increase the significance of the reversal pattern. To benefit from the Candlestick pattern, I look for clue to benefit from it! In this case, I go for volume and pattern (3) to confirm the robustness of the evening star. See, what we’ve? Relative low volume and another doji against prior doji. Based on Candlestick theory, (3) ought to be Black(here is red) and ideally long, so as to be convincing and hence dramatize its effect. So what does it means? Evidences gathered showed that the impact is only likely to be short-term in nature. This bearish intent served to temporarily halt the bullish uptrend for a few periods. The uptrend would likely to be flattened or consolidated for a while, but will then resume! Why so confident? Volume sync: down with low volume. Pattern (3) was another indecisive doji, not good enough to invite the bear in positively.
Conclusion: Scenario A

Friday, February 03, 2006

STI - What will be today?


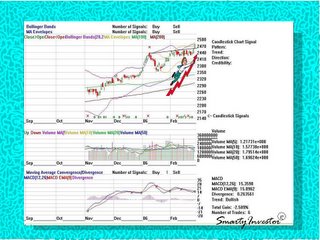
Look at the STI chart it looks a bit over extended. With Doji at this juncture, it it better to be cautious. All indicators are good and probability of upside remains strong, coupled with huge volume. However, With USA doing badly as in the chart, the rest would have to be played by seeing!

Wednesday, February 01, 2006

OCBC (O39) updated


OCBC has a beautiful Chart formation now. A breakout of the regression channel with vol of 6.4 Mil against the most recent 10 period average of 5.1 mil. The CCI demotes a short term of not overbought but remained neutral with longer term stands bullish. See the OBV against its trend line – a tilt positively upwards indicative of good buying pressure. The MACD with both signals lines rolled over and set to cross into bullish zone soon. A single bottom pattern empowered its bullish robustness. Also, its significance re-emphasized by the price drifting away and moved above the 15 D MA. UBS is bullish on OCBC with its emphasis on the bank’s capital realization


MY Email : Smartyinvestor@Gmail.com

YahooWeather Bull Fish Business Times TeleText Future Market Investor College Bloomberg NewsStreet Directory Yahoo Financial Google News CNA Financial CPF National Library Board Reuters e-finex HK Market News CommerceAsia ADVFNListed Company