STI - Doji, Doji, what do you mean?

A couple of readers had written to me to explain in detail the concern of these double doji. For those professionals, kindly bear with me for awhile.
Conversely, I will not dwell on the double Doji (FYI Doji got no plural), as per se. I look out for sign to unearth whether it is corrective down or a long term violation of the main trend (true reversal)
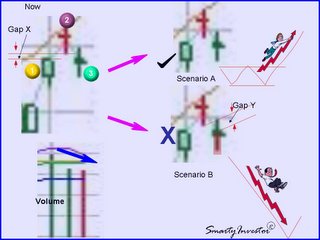
Let’s look at the chart in detail: (1) to (2) means impending reversal, i.e. alert/caution only especially after an extended uptrend.
The Gap X and Gap Y increase the significance of the reversal pattern. To benefit from the Candlestick pattern, I look for clue to benefit from it! In this case, I go for volume and pattern (3) to confirm the robustness of the evening star. See, what we’ve? Relative low volume and another doji against prior doji. Based on Candlestick theory, (3) ought to be Black(here is red) and ideally long, so as to be convincing and hence dramatize its effect. So what does it means? Evidences gathered showed that the impact is only likely to be short-term in nature. This bearish intent served to temporarily halt the bullish uptrend for a few periods. The uptrend would likely to be flattened or consolidated for a while, but will then resume! Why so confident? Volume sync: down with low volume. Pattern (3) was another indecisive doji, not good enough to invite the bear in positively.
Conclusion: Scenario A
0 Comments:
Post a Comment
<< Home