Tuesday, March 14, 2006

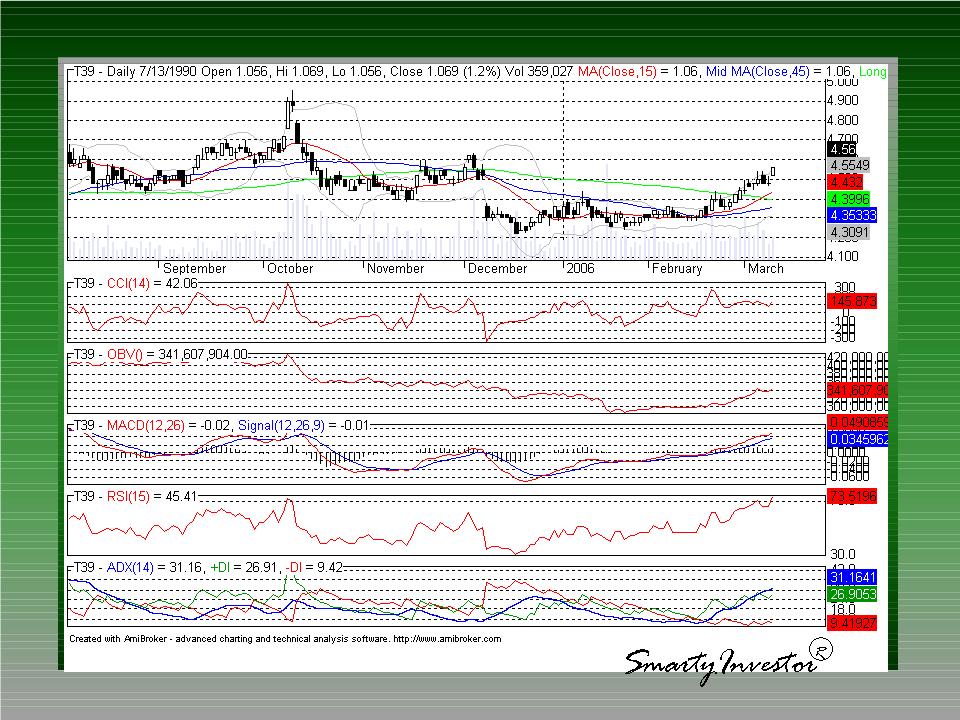
UTAC (U12) as Requested


UTAC (U12) is currently trading in the range of 89 to 96 cents. Thus we can safely take it as support and resistance respectively. From the Chart, we can know that U12 had luckily survived a Head and Shoulders formation (Red Crests).
Scrutinizing it yield scenario 1 and scenario 2. In (1) it would be a happy story, a so called Single Bottom Bullishness. In contrast, (2) (Green Crests), a bearish connotation of another mini Head and Shoulders.
Currently, U12 is still in downtrend and the SAR is also telling an unfavorable story. Further, ADX is –ve placed denoting downtrend is still not reversed yet. However, RSI and the William % R look good.
What ever it is, the faith of U12 lies in a Key. And that is the deciding 93 cents clearance! Above means up thrust, and below means downturn.

Monday, March 13, 2006

SPH - (T39) A Blue Chip that is no longer BLUE!


SPH (T39) I like SPH a lot now. Why? Very discipline in its behaviour. Price high with up volume and down with low volume. Just look at the ADX indicator, D+ positively up and at 31.61. With the offer of 2 billion for the Paragon, translated to 67 cents per share, 100% retracement ($4.90) ought to be near at hand. Most analysts target it at $5.10!

Sunday, March 12, 2006

StatsChpPac (s24) as requested


StatsChipac (S24) has breached a very difficult resistance of 1.18 and headed towards 1.25 then 1.34. Currently the wide price channel band is 1.10 to 1.34 and the narrow one is 1.18 and 1.25. Look like upside is of high probabilibty!

Chartered (C27) How high can you go?


Chartered (C27) has broken the tough resistance of 1.44 (60.1 % retracement of mid 2004) and going from : 1.49 => 1.68 => 1.75 (100%). Must also respect the 1.40 => 1.34 (50%). To me this would mean if it clear 1.49 we can expect a good ride to 1.75. If breakout happens to be false it will be back to 1.34.
P/s: This is just a educated theory based solely on F. Retracement theory as a guide only & certainly not a call to buy or sell.

Wednesday, March 08, 2006

MFS Tech (5BM) - Breaks out of Resistance, acheive new High!


MFS Tech (5BM) depicts a nice chart. Breaks new high. Again, anyway you put it, it is bullish. As in Chart A, we can see the Resistance of $1.04 broken and also the breakout from the Triangle. The Guppy Chart also showed strength of good uptrend; all the way up. In line with in, the ADX 5 day confirmed an inevitable continuation of up thrust. This is evidenced in the reversed small up tick with D+ positively placed. Our fear of ADX height and its about turn is muted as from its history; (5BM) tends to reverse only at approx 62! To add confidence to this believe, RSI 5days is exhibiting a very strong upward move towards 78. Put it critically, it is overbought. CCI 5 day agreed with it at 100. But looking at it, both are upward and not curling down yet. Hence, risk is worth taking. Volume at 7 mil, same figure as the past average 10 periods. This is normal. But the note worthy point is that volume is increasing over prior period.
Let’s cross over to chart b. All the good things in life! Breakout from Price Channel and Bollinger Band. Bull seems to appear judging from a white Hammer (in concept only –because tail must doubled its body and in down trend to form a prefect Hammer). Also notice the bullish divergence formed between the price and its momentum. Prices are likely to advance and sky is the limit. If the correction ever set in, be prepared to respect the 97 and 91 cents as support. Fundamentally result was out 2 days ago and its declaring of dividend. The market is now reacting to it. I think there is a rumor of it being a take over candidate. This could be the saint propping the price now!

Tuesday, March 07, 2006

Tomorrow - Which way the Wind blows?

Today most China Stocks were bloody so to speak! Other stocks also went down. STI was down 23.73 points & closed at 2489.15. This is the resistance point I previously predicted (2490). It does look like it is very hard to break without taking a pause. STI now look very overbought and extended. So it is better to be cautious and prudential... My sense is telling me it is safer to be in CASH rather than to be long on stock. As I’m writing now, Dow up 20 points, Nasqad down 11 points. Chartered, StatsChpac and Creative in USA also down. With today 3 digit down in Hang Seng and Nikkei and 29 points down in China, things look a bit scary. Whether which way the wind blows tomorrow, is a question which can be answered only after 5pm tomorrow. Let’s see how!

Monday, March 06, 2006

Hongguo (H14) - The Game is not Over!


Let’s go to the standards. The green arrows denote bullish and the grey arrow a neutral stand.
Particularly interesting notes are the Triple Tweezers Top that sits squarely on the resistance line of $0.385. Zooming in (1) the blue patch, we can clearly see the bulls are losing its dominant position. This is also in tune with the so called bearish rejection pattern.
However, I have many clues to debate against these notions. Firstly we can see (2) the concept of the 3 white soldiers marching smartly upward. Then, (3) there is this single bottom which add strength to support the bull. The fact that the base line of the single bottom rested at $0.385 doubled its significance.
Whether this rally is sustainable remains to be seen. To me, it is very interesting because a “very good or very bad “event shall happen. Not in between. I’ve seen this type of pattern rallied to new height more than downward failure. Currently the range is $0.34 to $0.385. If $0.385 is breached, it is unden1ably bullish all the way!
P/s: Metalstock software said as below: So I take it as a CONCEPT not actual!
“Three white candles occurred in the last 3 days . Although these candles were not big enough to create three white soldiers , the upwards pattern is bullish”.
Bottom without handle examples

Saturday, March 04, 2006

OCBC (O39) as Requested


OCBC (O39) chart has deteriorated. Most of the 5 day indicators said so. Namely, the ADX , RSI, CCI and the Volume indicators. In fact, CCI has registered an overbought status. Furthermore, there was a dangerously bearish convergence between the Momentum and Price. This would mean short term down trend very likely.
Although, there are clear indications of consolidation, there are many clues however, guarantee no avalanche triggering. Such are the: Price still above 10DEMA and the Guppy Chart still with its lower EMAs still erecting and widely spread. Also Candlestick wise, Doji has turned from Gravestone to Dragonfly. Personally, my sense is that the “tight range” consolidation ( Resistance $6.90 – Support $6.75)will drag on, unless otherwise revitalized by exciting news.
Fundamentally, I am convinced that, OCBC is good stock with all good figures and impressive profit. But if the Analyst now feel that the dividend/profit is not up to expectation, and downgraded it to neutral, & calling it as “not invigorating” enough in comparison to other banks; the short term price would be supressed. One of such report is reflected in the latest edition of The Edge (Mar 6 -12) echoing CIMK-GK’s report on the (Mar 1)

SingTel (T48) - To buy or to sell?


SingTel (T48) is getting beautiful again! With a slowly buildup of volume (3)after the drying off, T48 is all geared up! It would'nt take much effort to discern all the upward momentum these few days. Support was very strong at $2.60, which was not tested yet. I’ve been observing its price behavior and it was undulating at $2.63. Last Friday was a clean and positive break away from it and closed at $2.65. When this is breached the next resistance is $2.70. Once this is broken, and based on exploiting its previous trend against the RH X axis (1), it rest nicely at $2.82. This can be taken as the TP. Confidence of Singtel always buildup around dividend day which is drawing near. This somehow props the upward price movement!
In sum, the brave grasp without confirmation, the conservative one would want to wait and see the neckline (2) of $2.67 broken first before plunge in!. Of course I've my choice, you can have yours too!

Friday, March 03, 2006

Ellipsiz (E13) as Requested


Ellipsiz (E13) had a beautiful chart. The Price cut sharply across the 10 DEMA & moved upward decisively. The Guppy Chart also depicted a "fold up" smartly against the longer MAs’ peer. This signifies a strong up thrust convincingly, short term wise. In tandem, the Candlestick showed a runaway gap, which provides clue of an inevitable continuation of uptrend. Together with a top shadow, this candle could have been lethal, if it is in an extended uptrend. All are muted as currently it is a breakout against an ascending triangle. The CCI up at 50 would indicate to us that it is not overbought. Also its volume of 6 mil against the average of last 10 period (3.5mil) can be taken as increased interest. All the above pass my filters for entering a trade!
The –ve sides that I can see are the standing tail on top of the Candle, called “uptrust”. This, if seriously taken, would mean bull’s effort collapsed into bear dominance at the end of the day. Also ADX down at 25 cannot prove probability of a sure uptrend.
All in all, a very good candidate for entry, especially so when Tech share is currently in favour!

Thursday, March 02, 2006

Time Out

On the surface of it, STI looks good. But what actually happen only those who followed closely will know. China Stocks up in the morning and again losing its steam in the afternoon. So I’ve to go along. Piled up China Stock in the morning and disposed all in the afternoon with some profit. I see the Tech share like Chartered and StatsChip went up too fast to enter trade. I also tried the Federal (oil related) but went out when it also mellowed within the day. With commotions in Taiwan that angered China and tomorrow is Friday, a day in which most retail traders would avoid going long, it is better to stay on the sideline.

Wednesday, March 01, 2006

My CHINA Picks

As yesterday, the morning was bad. Then, suddenly things changed. My China Paper as per my captioned before, delivered good news and the China Shoe maker, the Hongguo start to shine. I've no choice but to jump onto the China Wagon. I’m glad, I did. Also as from now, everything starts to be “China” again. China Power, and China Milk. Just heard over the CNBC: interview with China Milk top brass, they sounded convincing enough. They claimed they’ve a way to make the cow pregnant fast. Ha, ha, I just know that only pregnant cow produces milk!. Also in China the trend is fresh milk and even in their StarBuck, fresh milk is a must. Remember, grasp any laggard that carry the logo CHINA.


MY Email : Smartyinvestor@Gmail.com

YahooWeather Bull Fish Business Times TeleText Future Market Investor College Bloomberg NewsStreet Directory Yahoo Financial Google News CNA Financial CPF National Library Board Reuters e-finex HK Market News CommerceAsia ADVFNListed Company